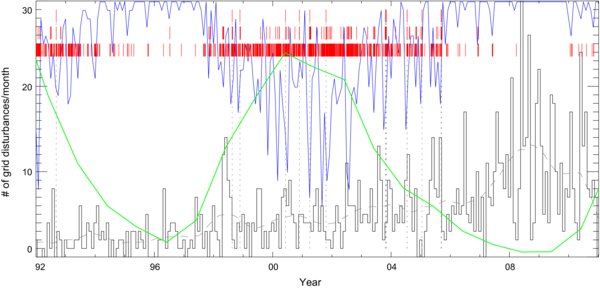
Fig. 1.
Download original image
Monthly frequency of grid disturbances (black histogram) and its 12-month running average (dashed gray line). Dates with (a) one of more M- or X-class flares, (b) one or more X-class flares, or (c) two or more X-class flares are marked by (red) bars near the top of the diagram. The monthly count of M- and X-class flares is shown inverted from the top by the blue line only to avoid confusing overlaps between this and the rate of grid disturbances, while still being able to view the relative behavior in the peaks of each of the two curves. The yearly sunspot number is overlaid as a (green) solid curve (divided by a factor of 5 for display purposes).
Current usage metrics show cumulative count of Article Views (full-text article views including HTML views, PDF and ePub downloads, according to the available data) and Abstracts Views on Vision4Press platform.
Data correspond to usage on the plateform after 2015. The current usage metrics is available 48-96 hours after online publication and is updated daily on week days.
Initial download of the metrics may take a while.