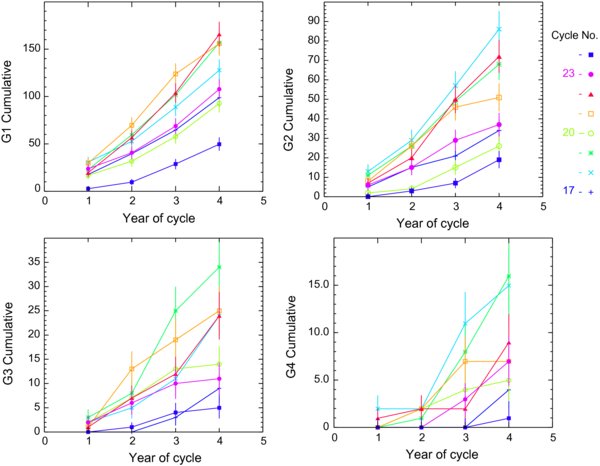
Fig. 3.
Download original image
Cumulative rate of G1 to G4 storm days during the first 4 years of solar cycles 17–24; the symbol indicates the cycle number. Error bars are given by the square root of the number of storm days. The storm rates during cycle 24 (blue squares) are clearly below those in the previous cycles, in particular for the weaker storms where there are better statistics. Note also that the rates for cycles 17, 20, and 23, the weaker cycles in Figure 1 tend to lie below those for the stronger cycles.
Current usage metrics show cumulative count of Article Views (full-text article views including HTML views, PDF and ePub downloads, according to the available data) and Abstracts Views on Vision4Press platform.
Data correspond to usage on the plateform after 2015. The current usage metrics is available 48-96 hours after online publication and is updated daily on week days.
Initial download of the metrics may take a while.