Open Access
Fig. 12
Download original image
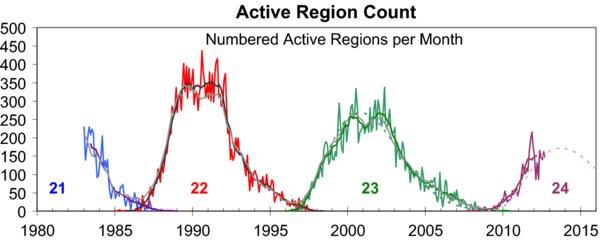
Numbered active regions within 70° of CM per month. Different cycles are plotted with different colors. The predicted Cycle 24 is shown as the dashed purple curve. We are very close to a drawn out solar maximum at this time of writing.
Current usage metrics show cumulative count of Article Views (full-text article views including HTML views, PDF and ePub downloads, according to the available data) and Abstracts Views on Vision4Press platform.
Data correspond to usage on the plateform after 2015. The current usage metrics is available 48-96 hours after online publication and is updated daily on week days.
Initial download of the metrics may take a while.