Open Access
Fig. 1.
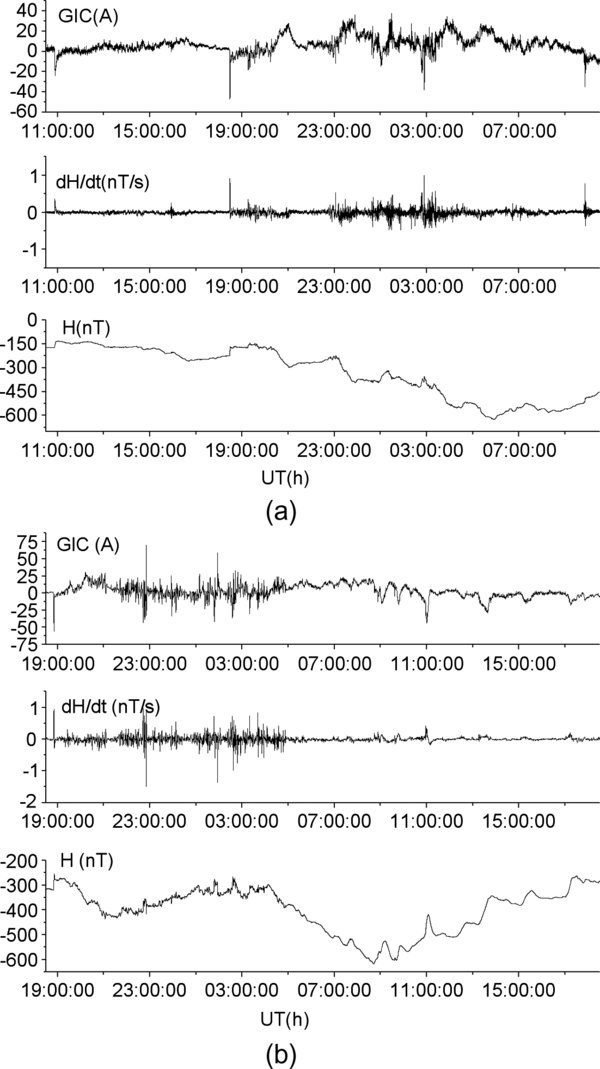
Download original image
GIC data at the Ling’ao nuclear power plant on 7–8 (a) and 9–10 (b) November 2004. The horizontal component of the geomagnetic field and its variation rate are also shown based on data from the Zhaoqing Geomagnetic Observatory.
Current usage metrics show cumulative count of Article Views (full-text article views including HTML views, PDF and ePub downloads, according to the available data) and Abstracts Views on Vision4Press platform.
Data correspond to usage on the plateform after 2015. The current usage metrics is available 48-96 hours after online publication and is updated daily on week days.
Initial download of the metrics may take a while.