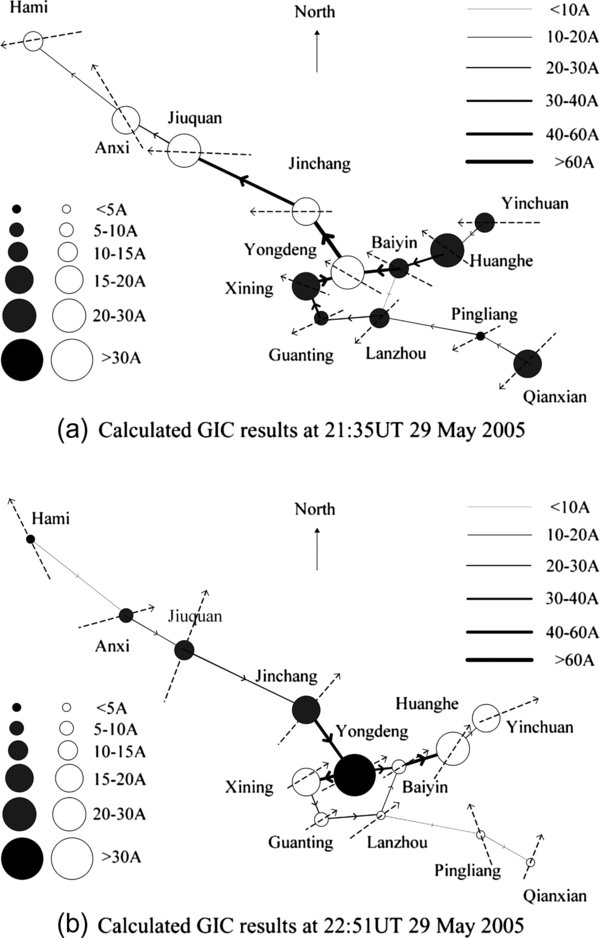
Fig. 8.
Download original image
Snapshots at 21:35 on 29 May 2005 (a) and at 22:51UT on 29 May 2005 (b) of calculated GIC at different sites of the Chinese Northwest 750 kV power grid. The solid circle represents that the GIC flow into the power network from ground, the hollow one means that GIC flow into the ground. The dashed line with an arrow represents the direction of electric field at that substation (a) calculated GIC results at 21:35UT 29 May 2005 and (b) calculated GIC results at 22:51UT 29 May 2005.
Current usage metrics show cumulative count of Article Views (full-text article views including HTML views, PDF and ePub downloads, according to the available data) and Abstracts Views on Vision4Press platform.
Data correspond to usage on the plateform after 2015. The current usage metrics is available 48-96 hours after online publication and is updated daily on week days.
Initial download of the metrics may take a while.