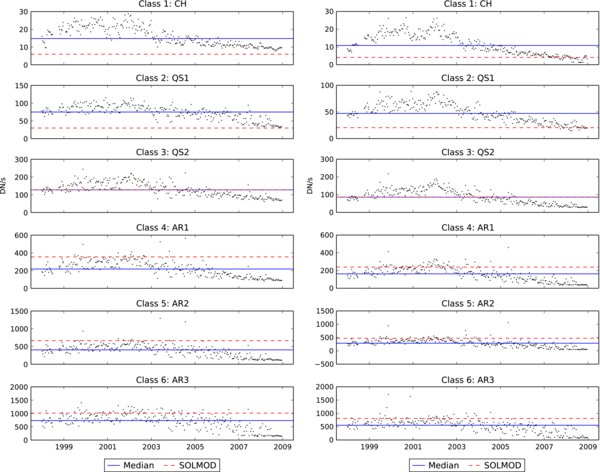
Fig. 4.
Download original image
Evolution of centers of classes computed with SPoCA2 on a frame-by-frame basis on EIT 171 Å (left) and 195 Å (right) images. The dataset consists of one image per bandpass every 14 days during the period 1 January 1998 until 31 December 2008. The blue solid lines represent the median value over the whole period, while the red dotted lines are the values found using the SOLMOD ratios.
Current usage metrics show cumulative count of Article Views (full-text article views including HTML views, PDF and ePub downloads, according to the available data) and Abstracts Views on Vision4Press platform.
Data correspond to usage on the plateform after 2015. The current usage metrics is available 48-96 hours after online publication and is updated daily on week days.
Initial download of the metrics may take a while.