Fig. 1.
Download original image
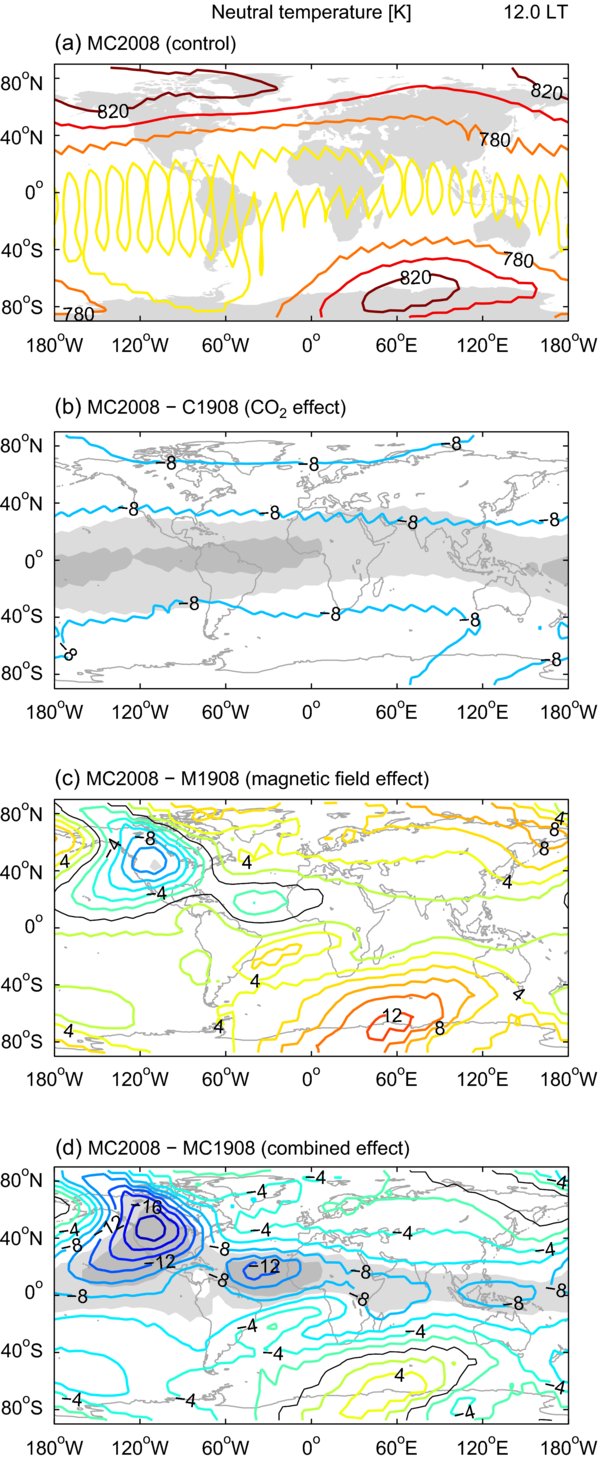
Sixty-one-day mean neutral temperature for the control case (MC2008; panel a) and the difference with C1908, M1908, and MC1908 (panels b–d) at 12 LT at a pressure level of 3.2 × 10⁻⁸ hPa (~300 km). The contour interval for the difference plots is 2 K between −12 and +12 K, with an additional contour at −16 K for the bottom panel. Light (dark) shading indicates statistical significance at the 95% (99%) level.
Current usage metrics show cumulative count of Article Views (full-text article views including HTML views, PDF and ePub downloads, according to the available data) and Abstracts Views on Vision4Press platform.
Data correspond to usage on the plateform after 2015. The current usage metrics is available 48-96 hours after online publication and is updated daily on week days.
Initial download of the metrics may take a while.