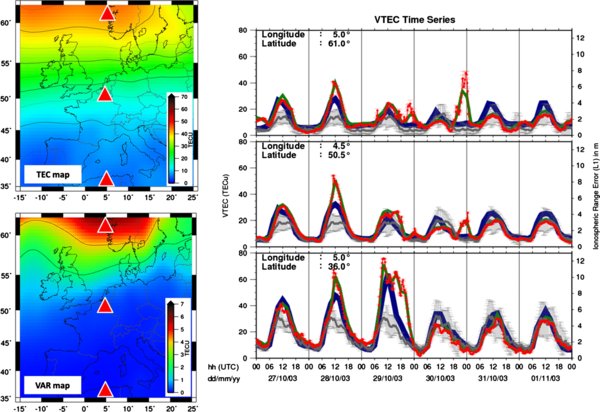
Fig. 4.

Download original image
NRT ROB-TEC maps during the 2003 Halloween storm. Left: ROB-TEC maps estimated between 22:15 and 22:30 UTC for October 30, 2003. Left top: ROB-TEC map estimated in NRT. Left bottom: ROB-TEC variability map during the 15-min time span. Right: 6-day vTEC time series extracted from ROB-TEC maps at three different geographic locations represented by the red triangle on the maps (top: northern part of the maps; middle: above Brussels, bottom: southern part of the maps). The red dots are the vTEC time series estimated in NRT. The grey dots represent the expected ionospheric behaviour based on the median vTEC from the 15 previous days. The green and blue lines are the interpolated values from the IGS and ESA final GIMs respectively.
Current usage metrics show cumulative count of Article Views (full-text article views including HTML views, PDF and ePub downloads, according to the available data) and Abstracts Views on Vision4Press platform.
Data correspond to usage on the plateform after 2015. The current usage metrics is available 48-96 hours after online publication and is updated daily on week days.
Initial download of the metrics may take a while.


