Fig. 6.

Download original image
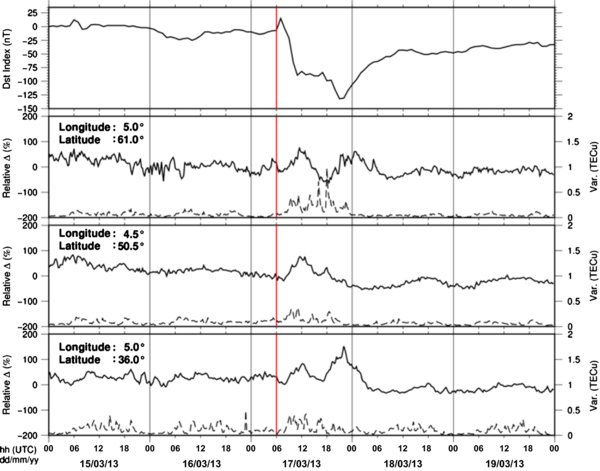
Dst index and ROB-TEC products for the period March 15 to March 19, 2013. The red line is the storm onset of the intense geomagnetic storm on March 17. Top: the Dst index as delivered by the WDC Kyoto Observatory. Bottom: the three time-series extracted from ROB-TEC maps at three different geographic locations shown on Figure 4. The bold line represents the relative differences between the ROB-TEC values and the median from the 15 previous days. The dashed line is the variability of the vTEC estimated in NRT.
Current usage metrics show cumulative count of Article Views (full-text article views including HTML views, PDF and ePub downloads, according to the available data) and Abstracts Views on Vision4Press platform.
Data correspond to usage on the plateform after 2015. The current usage metrics is available 48-96 hours after online publication and is updated daily on week days.
Initial download of the metrics may take a while.


