Fig. 2.
Download original image
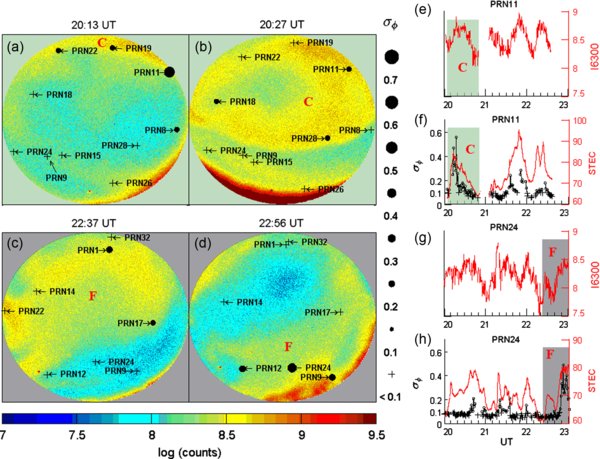
(a–d) A sequence of images from the ASIP at channel 630.0 nm showing the observation of two polar cap patches (patches C and F). The black circles and plus signs indicate the locations of GPS satellites. The size of the circles relates to the σϕ strength showing on the right of the all-sky images, whereas black plus signs mean no scintillation was observed (σϕ < 0.1). (a, b) Patch C came into the FOV and continued to move southward. The scintillation was observed when the patch passed through the line of sight (LOS) of several satellites. (c, d) Patch F entered into the LOS of PRN12 and PRN24, and enhanced phase scintillations were observed. (e) The temporal variation of optical emission at 630.0 nm channel corresponding to the locations of PRN11 in units of log (counts). (f) σϕ (black) and the Slant TEC (red line) from PRN11. σϕ are plotted as black circles when σϕ > = 0.1, otherwise as plus signs. The shaded regions in (e, f) correspond to the time period when patch C passed through the LOS of PRN11. The data gap from 20:50 UT to 21:05 UT in (e, f) is due to loss of lock; PRN11 moved out of the FOV at 22:35 UT, therefore there is no data after this time. (g, h) The same format as (e, f) but for PRN24. The shaded regions show the pass of patch F.
Current usage metrics show cumulative count of Article Views (full-text article views including HTML views, PDF and ePub downloads, according to the available data) and Abstracts Views on Vision4Press platform.
Data correspond to usage on the plateform after 2015. The current usage metrics is available 48-96 hours after online publication and is updated daily on week days.
Initial download of the metrics may take a while.