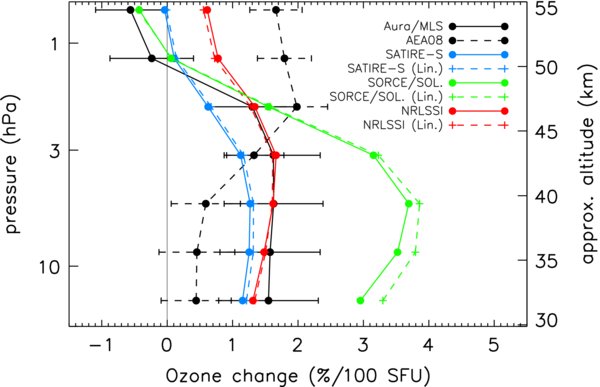
Fig. 1.
Download original image
The solar cycle signal in the ozone profile, ΔO3(z), in the equatorial stratosphere: (i) derived from observations, (dashed black curves) Austin et al. (2008) and (solid black) AURA/MLS; (ii) derived using various solar spectra as input to the HP model: (solid blue) SATIRE-S, (red) NRLSSI and (green) SORCE/SOLSTICE (using SATIRE-S above 290 nm) and (iii) constructed from the (dashed) linear approximation with the SC flux changes given in Table 1.
Current usage metrics show cumulative count of Article Views (full-text article views including HTML views, PDF and ePub downloads, according to the available data) and Abstracts Views on Vision4Press platform.
Data correspond to usage on the plateform after 2015. The current usage metrics is available 48-96 hours after online publication and is updated daily on week days.
Initial download of the metrics may take a while.