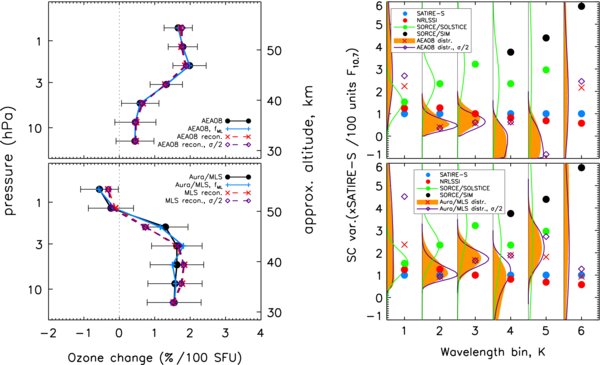
Fig. 3.
Download original image
The (left) ΔO3(z) profile and the (right) respective SC SSI change in multiples of SATIRE-S for the six wavelength bands for (top) AEA08 and (bottom) Aura/MLS. The relative variability of SATIRE-S (blue), NRLSSI (red), SORCE/SOLSTICE (green) and SORCE/SIM (black) is represented by the filled circles. The green distribution is the uncertainty on the SORCE/SOLSTICE data. Posterior distributions are shown for the sampled SC changes using original (orange, filled) and halved (purple line) error bars. Red (crosses) and purple (diamonds) ΔO3(z) profiles are the linear model profiles from the best-fit sampled parameters (also crosses and diamonds in the right-hand plots) with priors employed for the original and halved errors; the values of these individual, best-fit models are listed in columns 4 and 6 of Table 4.
Current usage metrics show cumulative count of Article Views (full-text article views including HTML views, PDF and ePub downloads, according to the available data) and Abstracts Views on Vision4Press platform.
Data correspond to usage on the plateform after 2015. The current usage metrics is available 48-96 hours after online publication and is updated daily on week days.
Initial download of the metrics may take a while.