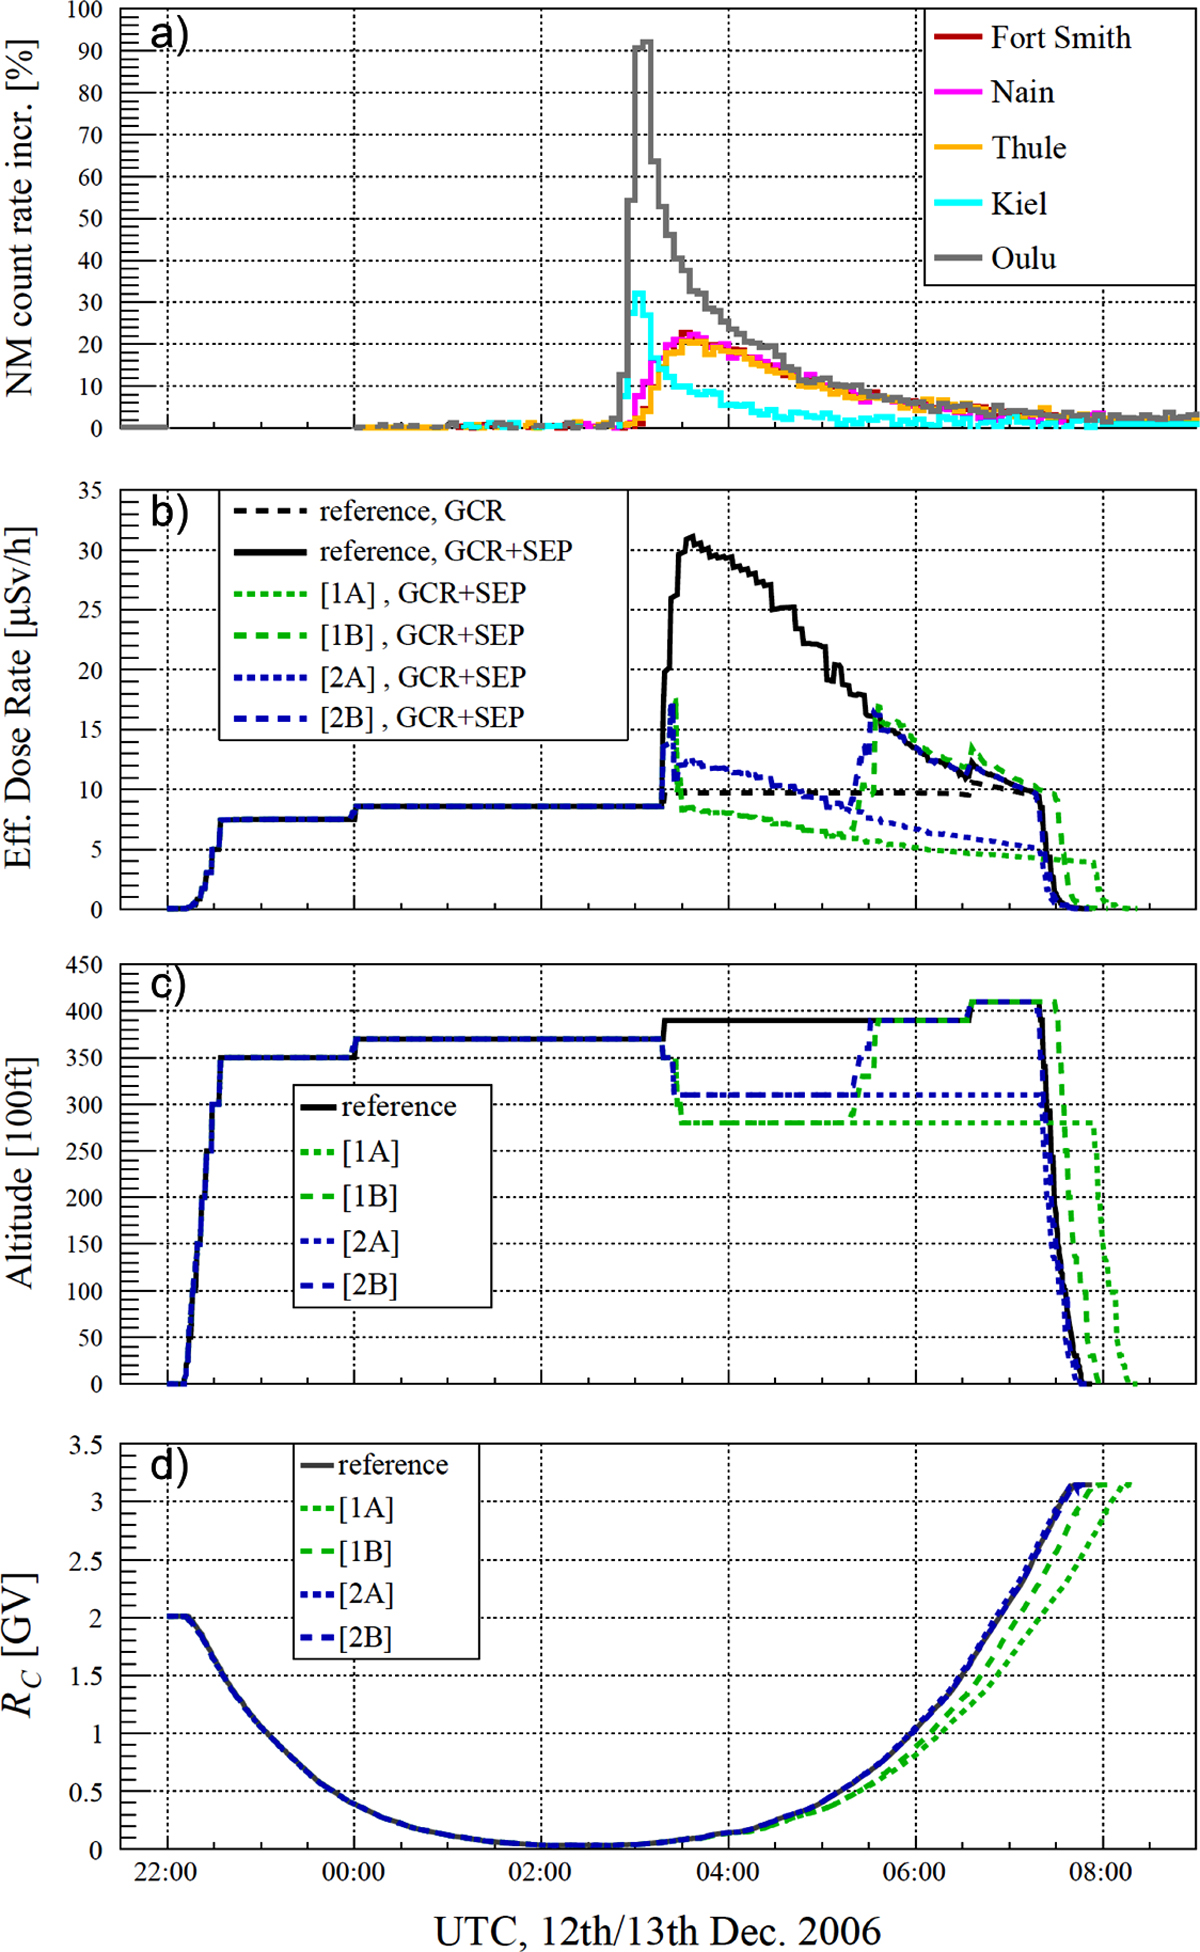
Fig. 2.
Download original image
From top to bottom: (a) relative count rate increases of selected neutron monitor stations located in proximity of the analysed flight route (cf. Fig. 1); (b) calculated effective dose rates from galactic cosmic rays (GCR) and solar energetic particles (SEP) for the different scenarios; (c) altitude profiles of the different flight scenarios; (d) effective cut-off rigidities Rc of the different scenarios.
Current usage metrics show cumulative count of Article Views (full-text article views including HTML views, PDF and ePub downloads, according to the available data) and Abstracts Views on Vision4Press platform.
Data correspond to usage on the plateform after 2015. The current usage metrics is available 48-96 hours after online publication and is updated daily on week days.
Initial download of the metrics may take a while.