Open Access
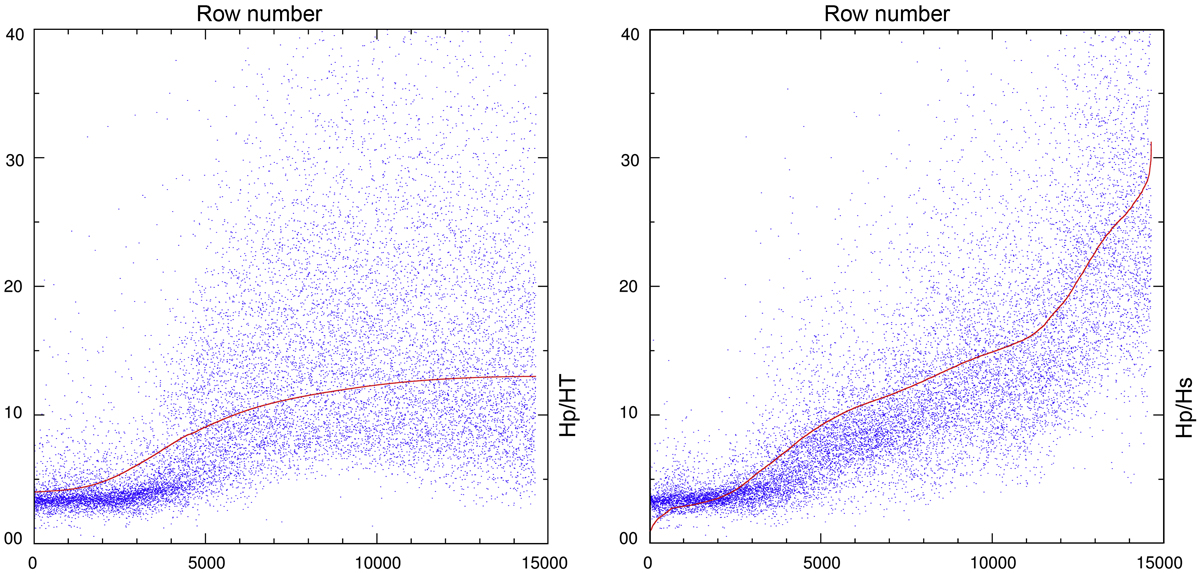
Fig. 6.
Download original image
Data rows are ordered by increasing values of old model (left plot) and new model (right plot) results. The blue dots are the data and red lines are the model results.
Current usage metrics show cumulative count of Article Views (full-text article views including HTML views, PDF and ePub downloads, according to the available data) and Abstracts Views on Vision4Press platform.
Data correspond to usage on the plateform after 2015. The current usage metrics is available 48-96 hours after online publication and is updated daily on week days.
Initial download of the metrics may take a while.