Fig. 4.
Download original image
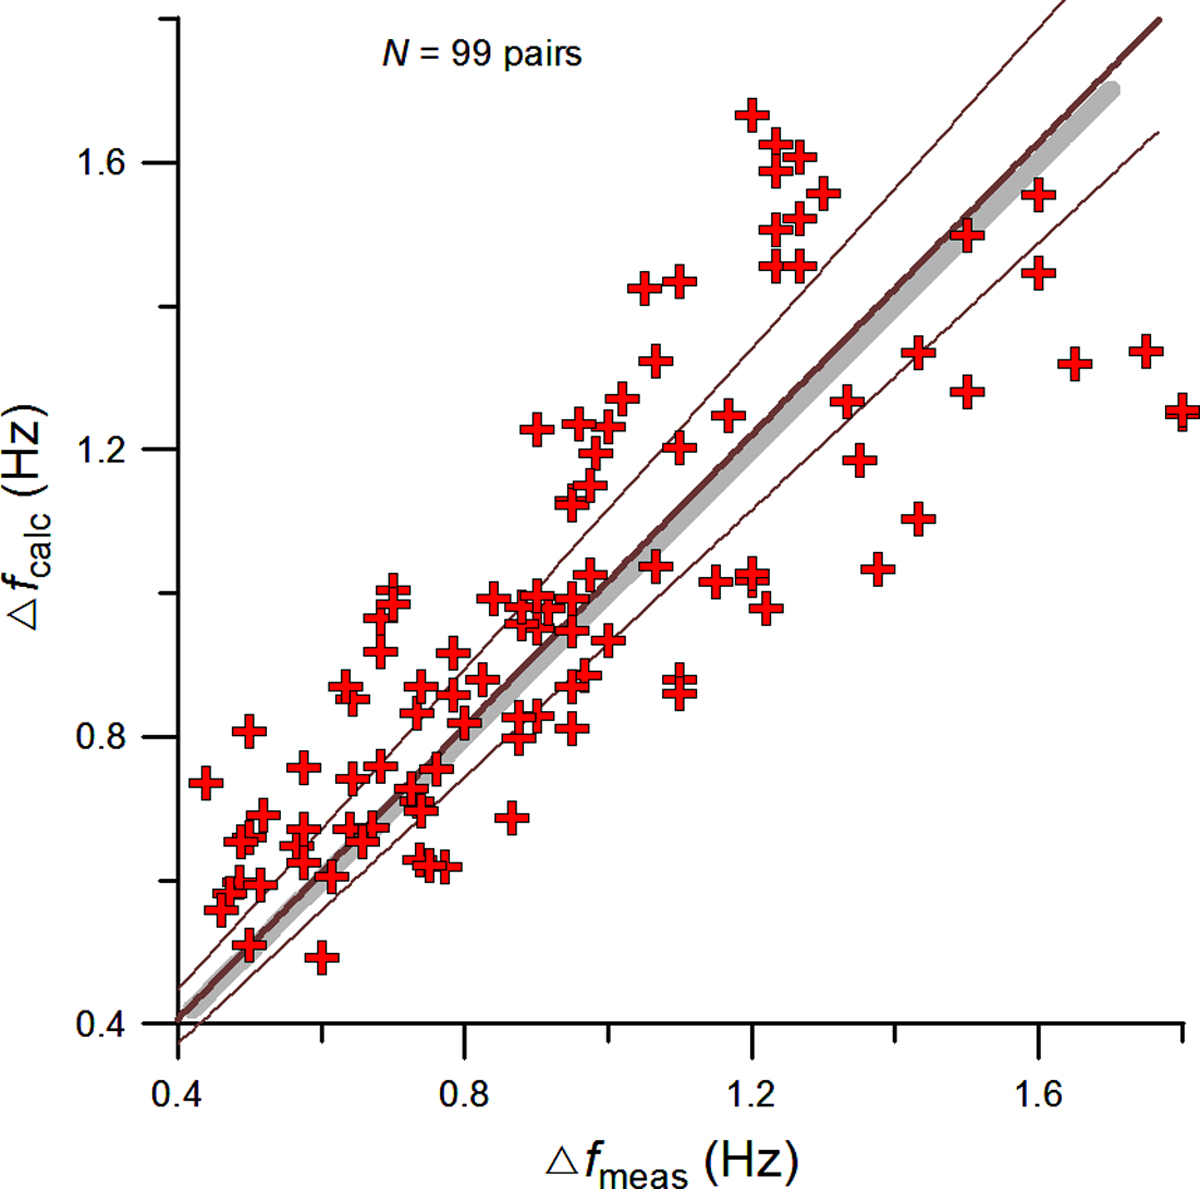
Calculated ∆f calc versus measured ∆f meas values of the IAR frequency scale as a result of calculations based on the modified IRI-2012 model with the inclined profile elongated along the local geomagnetic field line. Bold brown line is the regression line running through the origin of coordinates; thin lines are the 99% confidence limits; gray line is the line of perfect match Δf calc = Δf meas.
Current usage metrics show cumulative count of Article Views (full-text article views including HTML views, PDF and ePub downloads, according to the available data) and Abstracts Views on Vision4Press platform.
Data correspond to usage on the plateform after 2015. The current usage metrics is available 48-96 hours after online publication and is updated daily on week days.
Initial download of the metrics may take a while.