Fig. 12.
Download original image
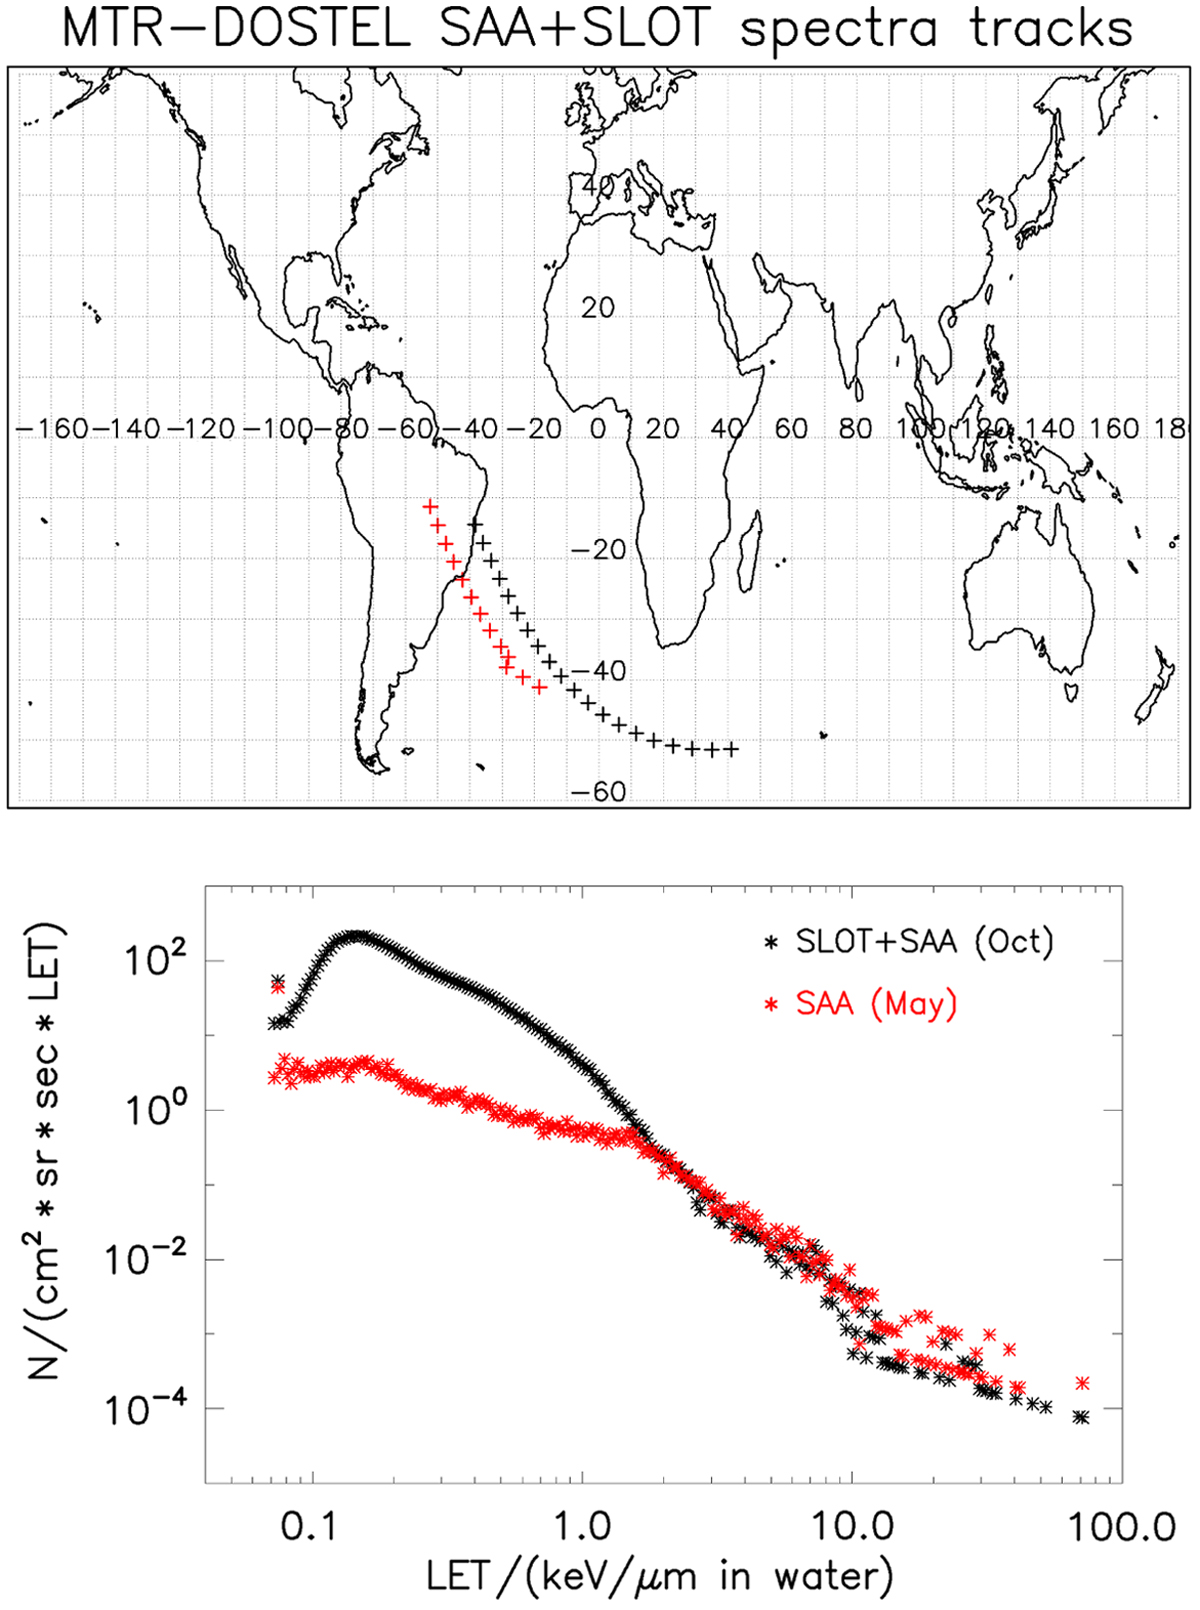
The lower panel shows two LET-spectra measured by MTR-DOSTEL. In red, a spectrum of descending inner belt crossing in May 2004 is shown. The black spectrum shows the crossing of the inner belt and the EPF in September 2004. The upper panel shows the respective orbits in the same color code. An enhancement of particles with an LET below 2 keV μm−1, which peaks at about 0.15 keV μm−1, can be seen in the combined inner radiation belt and EPF spectrum.
Current usage metrics show cumulative count of Article Views (full-text article views including HTML views, PDF and ePub downloads, according to the available data) and Abstracts Views on Vision4Press platform.
Data correspond to usage on the plateform after 2015. The current usage metrics is available 48-96 hours after online publication and is updated daily on week days.
Initial download of the metrics may take a while.