Fig. 1.
Download original image
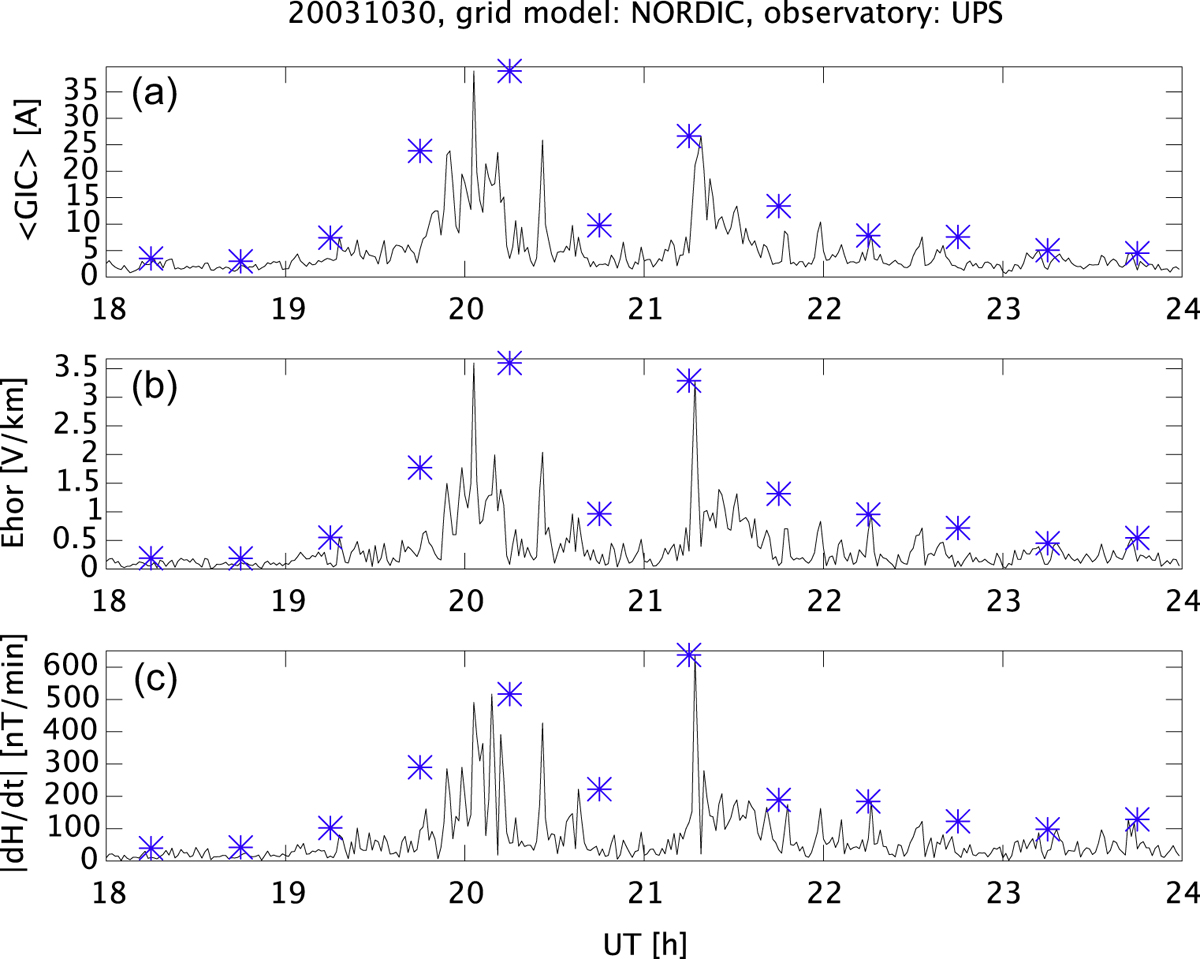
(a) Sum of GIC divided by the number of nodes in the Nordic power grid at 18–24 UT on 30 October 2003 as 1-min values, (b) horizontal electric field at UPS, (c) time derivative of the horizontal magnetic field (|dH/dt|) at UPS. 30-min maximum values are plotted as blue asterisks at the midpoints of each 30-min period of 18:00–18:29, 18:30–18:59, etc.
Current usage metrics show cumulative count of Article Views (full-text article views including HTML views, PDF and ePub downloads, according to the available data) and Abstracts Views on Vision4Press platform.
Data correspond to usage on the plateform after 2015. The current usage metrics is available 48-96 hours after online publication and is updated daily on week days.
Initial download of the metrics may take a while.