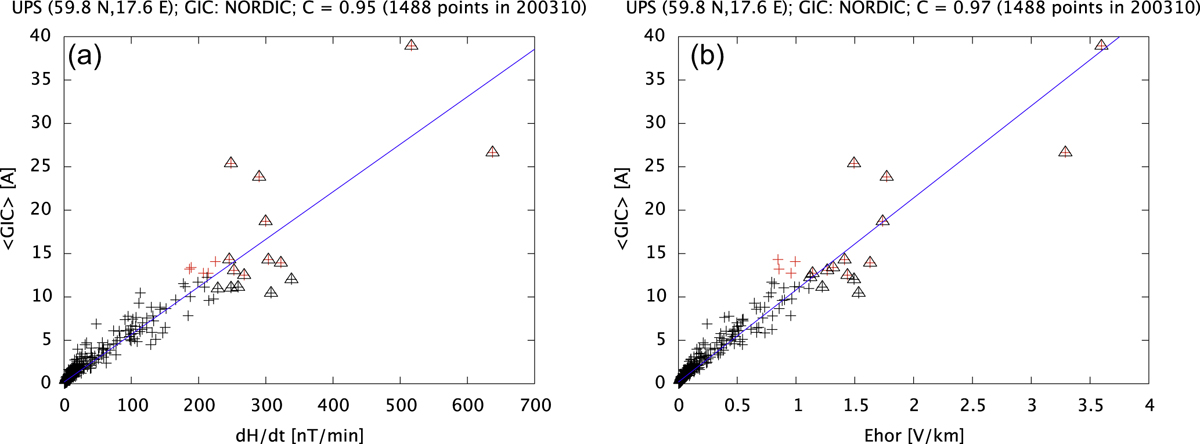
Fig. 4.
Download original image
30-min maximum of the sum of GIC divided by the number of nodes in the Nordic high-voltage power grid in October 2003 as a function of |dH/dt|30 (a) and |E|30 (b) at UPS. Red crosses indicate the 15 largest values of GIC30. Triangles indicate the 15 largest values of |dH/dt|30 or |E|30. The blue curve is a fitted straight line.
Current usage metrics show cumulative count of Article Views (full-text article views including HTML views, PDF and ePub downloads, according to the available data) and Abstracts Views on Vision4Press platform.
Data correspond to usage on the plateform after 2015. The current usage metrics is available 48-96 hours after online publication and is updated daily on week days.
Initial download of the metrics may take a while.