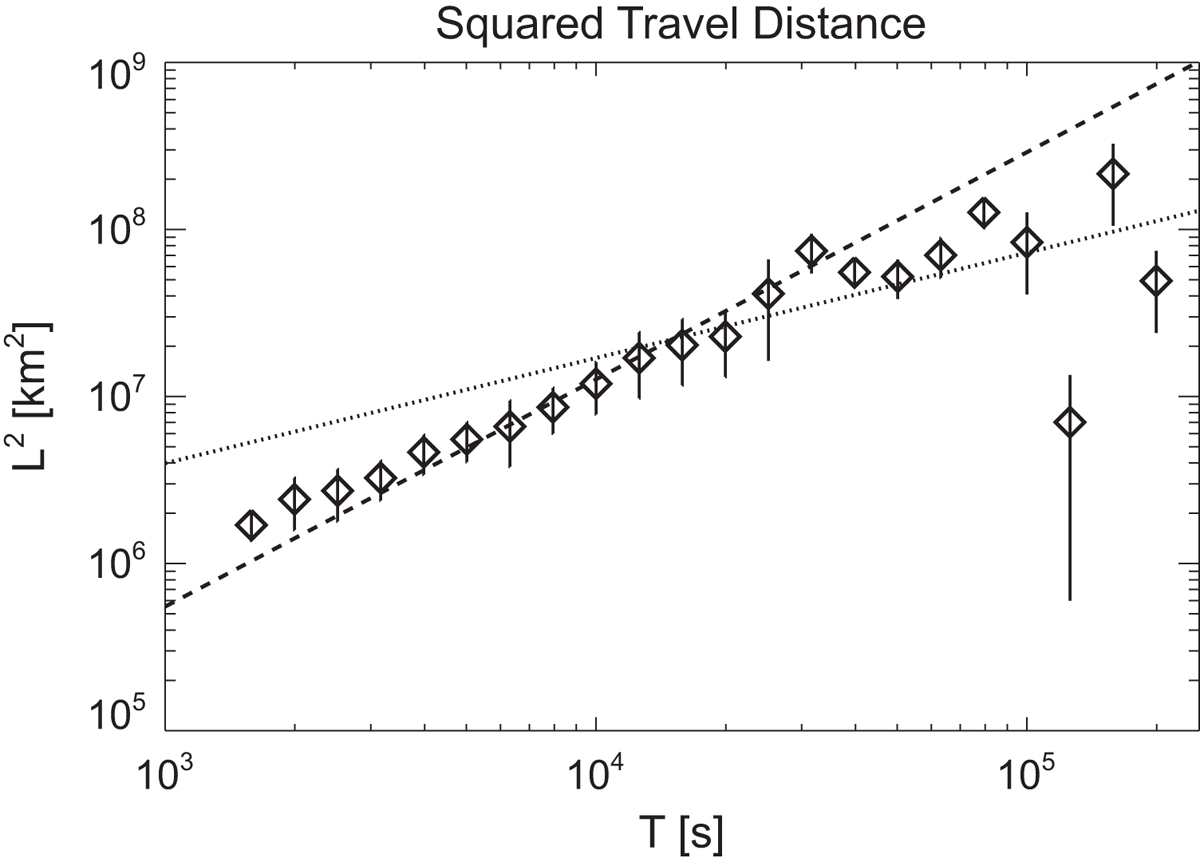
Fig. 7.
Download original image
Relationship between the elapsed time and the squared displacement of the patches. Diamonds show the average of the squared displacement and bars show the one-sigma error in each bin. The dashed and dotted lines show the fitting results below and above the time scale of 2 × 10⁴ s, respectively.
Current usage metrics show cumulative count of Article Views (full-text article views including HTML views, PDF and ePub downloads, according to the available data) and Abstracts Views on Vision4Press platform.
Data correspond to usage on the plateform after 2015. The current usage metrics is available 48-96 hours after online publication and is updated daily on week days.
Initial download of the metrics may take a while.