Fig. 4.
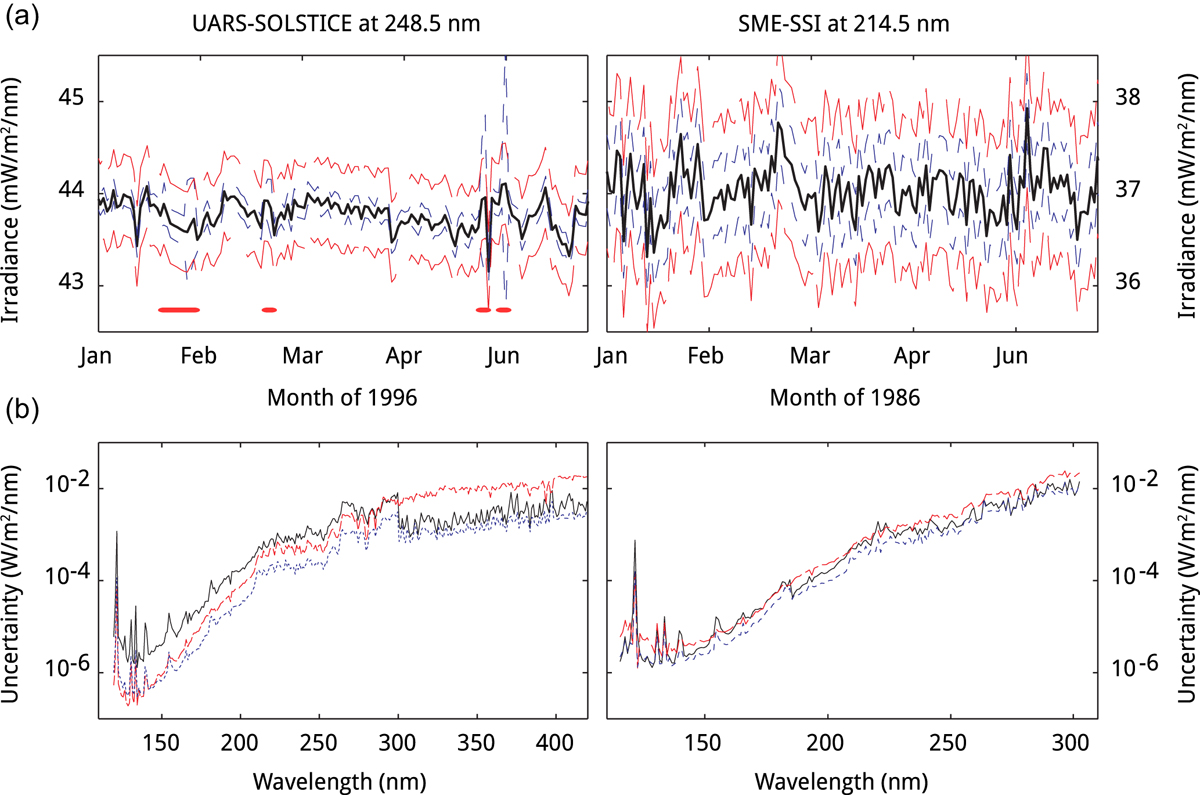
Download original image
(a) Measured SSI (black) of UARS SOLSTICE at 248.5 nm (left) and SME at 214.5 nm, along with the precision provided by PIs (long-dashed red) and our own estimate of precision (short-dashed blue). We also mark the times where we have detected outliers (red circles). Two strong outliers are visible in June, while two possible, but unlikely outliers are around 20 February 1996. The interpolated data from end of January have also been correctly classified as outliers. (b) The 1 − σ standard deviation of the spectral variability (solid black) for each wavelength and the provided (long-dashed red) and estimated (short-dashed blue) averaged uncertainties per wavelength of the two instruments from (a), but for the full time-range (3 Oct 1991 to 29 Sept 2001 for UARS/SOLSTICE and 8 Oct 1981 to 12 Apr 1989 for SME/UV). As discussed in the text, our own estimates are, by definition, bounded by the variability of the data.
Current usage metrics show cumulative count of Article Views (full-text article views including HTML views, PDF and ePub downloads, according to the available data) and Abstracts Views on Vision4Press platform.
Data correspond to usage on the plateform after 2015. The current usage metrics is available 48-96 hours after online publication and is updated daily on week days.
Initial download of the metrics may take a while.