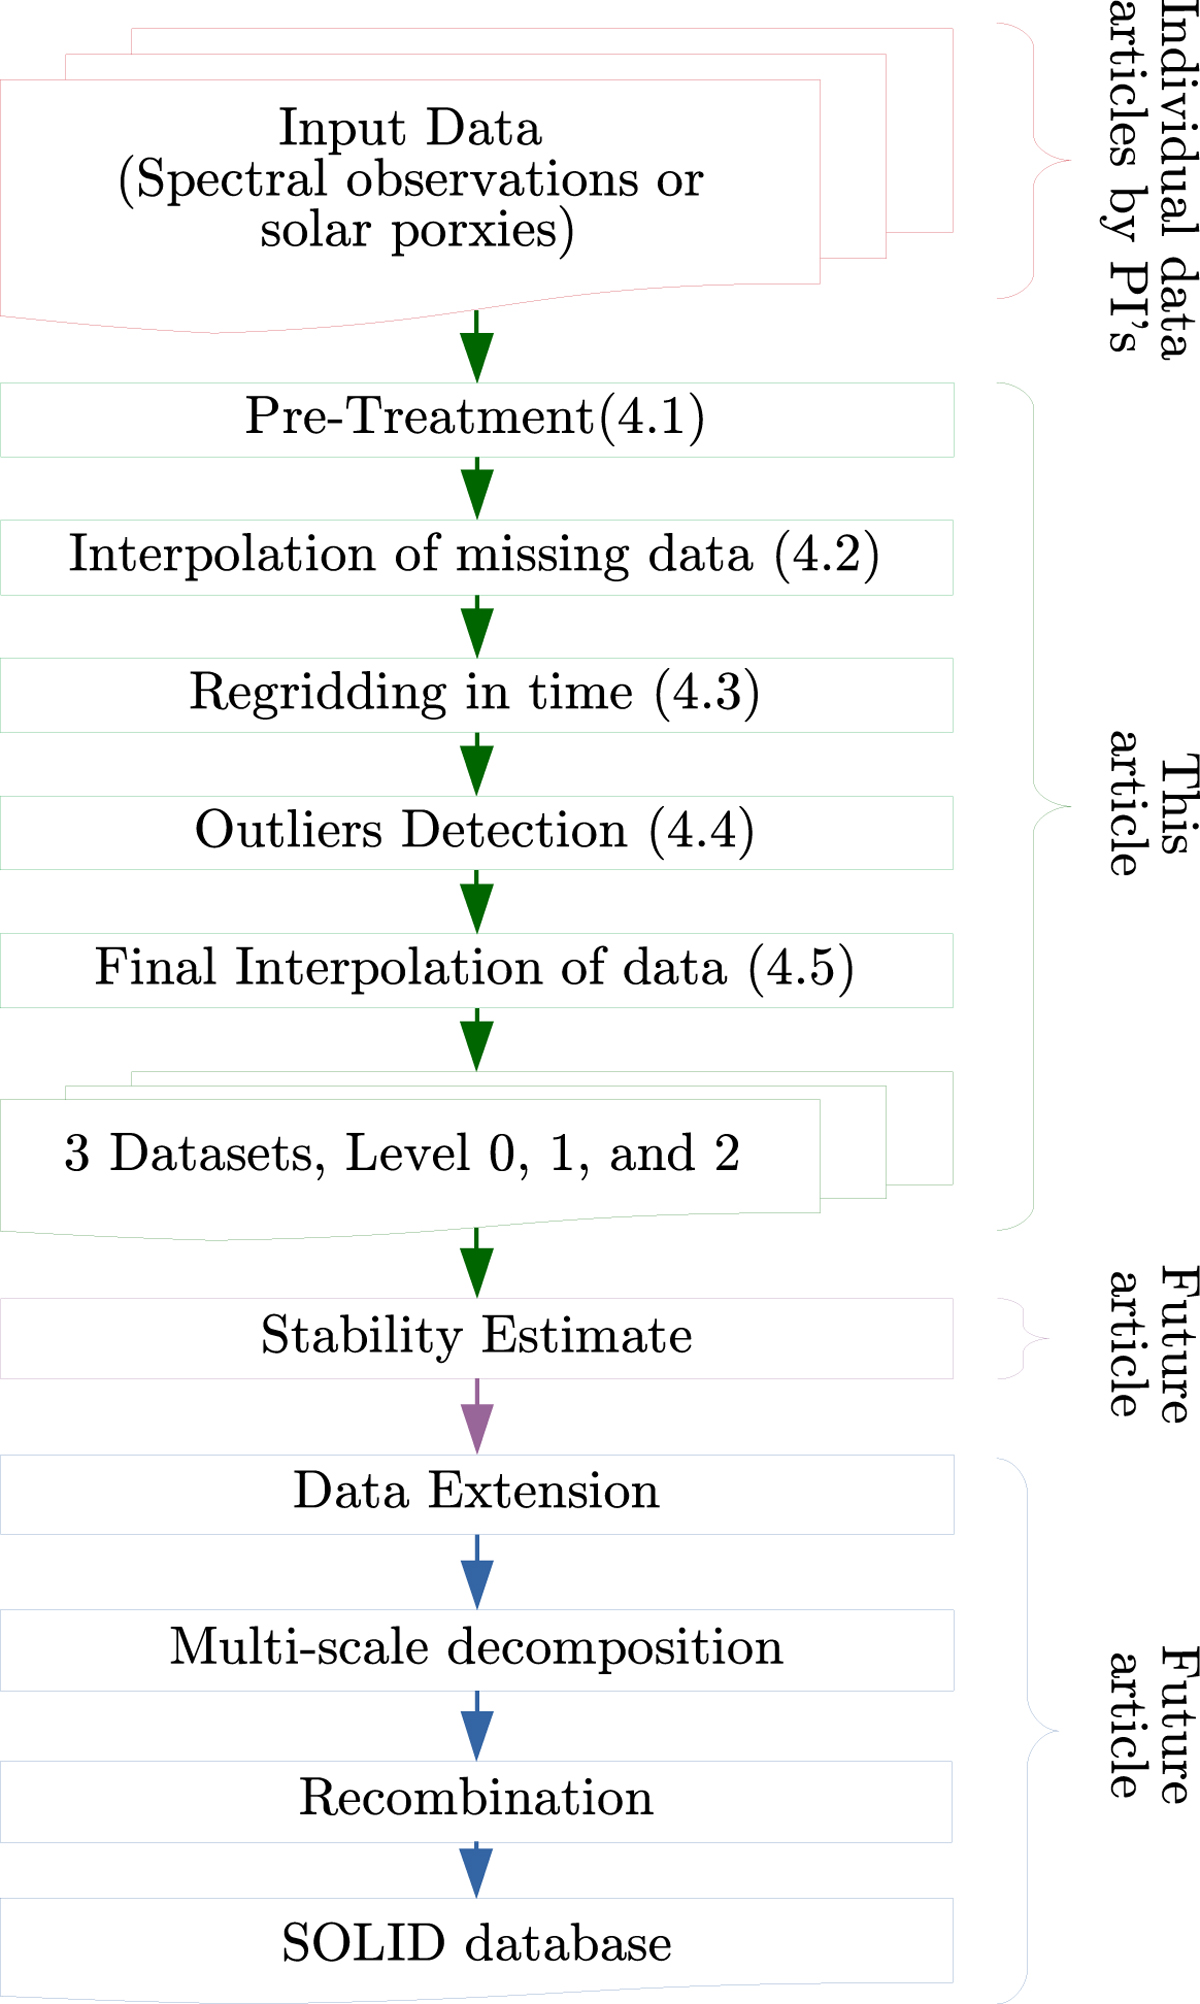
Fig. 5.
Download original image
A graphical overview of all steps to construct the final composite. The input data (red) are provided by instrument teams (References can be found in Appendix A). This work discusses the construction of the homogeneous individual datasets (green, numbers link to the corresponding sections), while the stability estimation (magenta) is discussed in a separate paper. The combination of all these datasets will be provided in the future (blue).
Current usage metrics show cumulative count of Article Views (full-text article views including HTML views, PDF and ePub downloads, according to the available data) and Abstracts Views on Vision4Press platform.
Data correspond to usage on the plateform after 2015. The current usage metrics is available 48-96 hours after online publication and is updated daily on week days.
Initial download of the metrics may take a while.