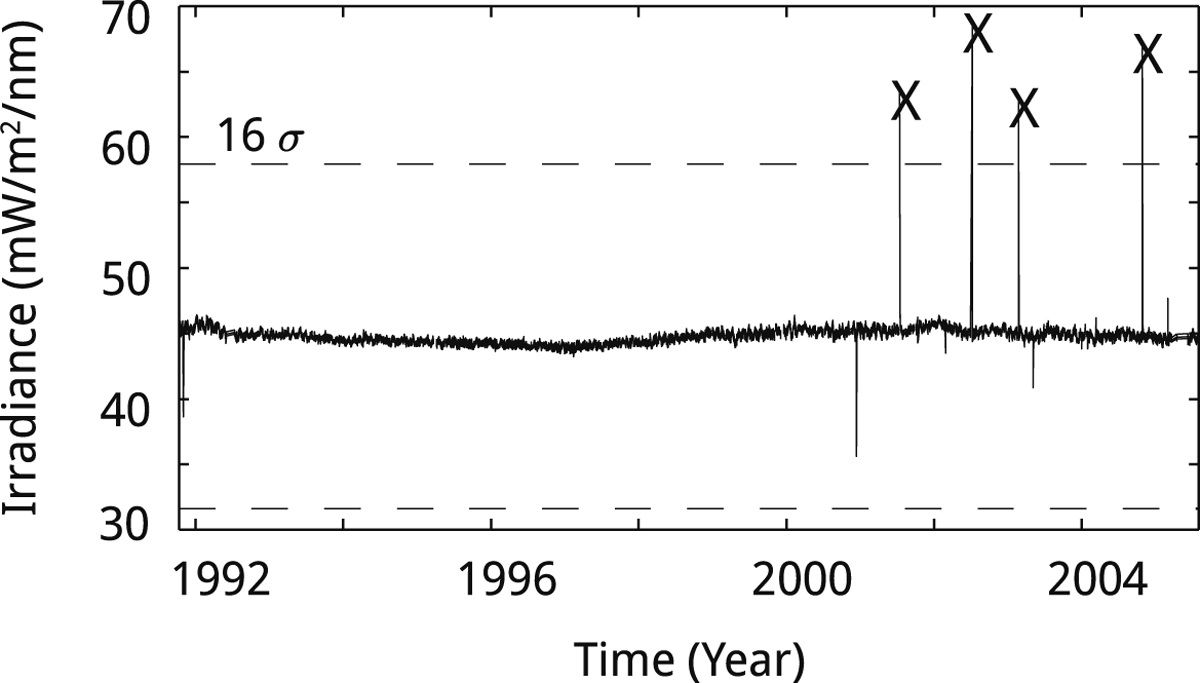
Fig. 6.
Download original image
UARS/SUSIM at 239.5 nm as provided by the instrument team and the 16 σ thresholds (dashed). All points outside of the thresholds are marked as outliers, replaced by linear interpolation. Further possible outliers are selected and handled in Section 4.4. We define their uncertainties as the difference from the original data to the interpolated points. In the case of SUSIM, these outliers occur directly after instrumental data gaps, giving further credence to the possibility of instrumental, non-physical, outliers.
Current usage metrics show cumulative count of Article Views (full-text article views including HTML views, PDF and ePub downloads, according to the available data) and Abstracts Views on Vision4Press platform.
Data correspond to usage on the plateform after 2015. The current usage metrics is available 48-96 hours after online publication and is updated daily on week days.
Initial download of the metrics may take a while.