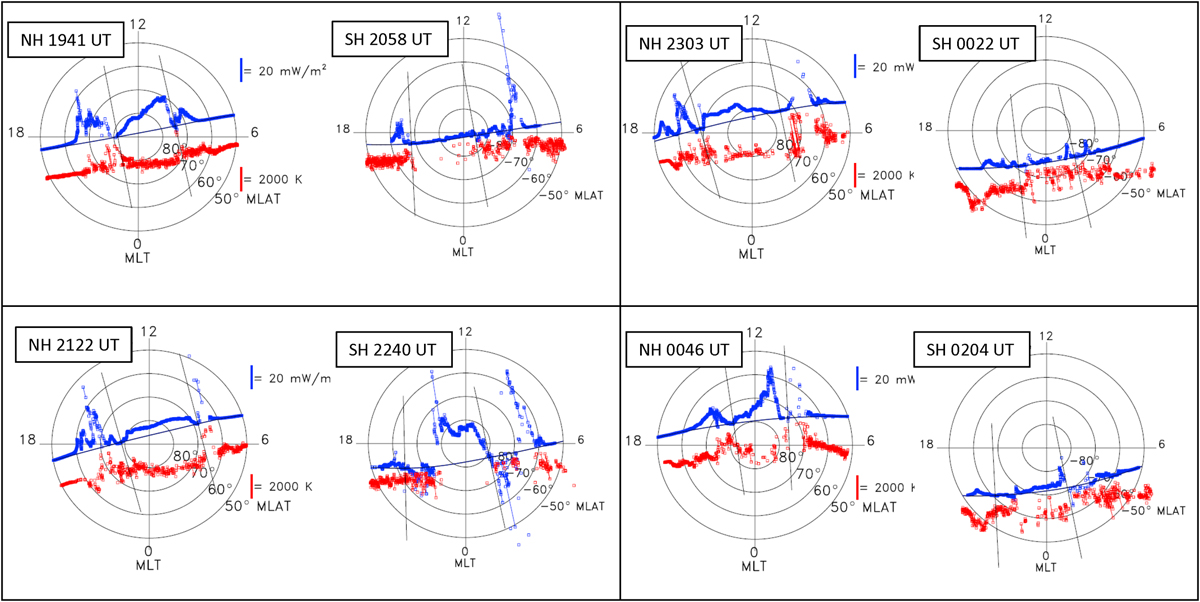
Fig. 7.

Download original image
DMSP F16 observations of Poynting flux (blue) and ion temperature, Ti (red) along the satellite orbit track for the same four orbits as shown in Figure 6. Poynting flux is plotted with maximum positive values toward the dayside, i.e. upward from the orbit track. Ti is plotted with maximum positive values toward the nightside, i.e. downward from the orbit track In each panel, the hemisphere and time of F16 crossing the highest latitude are indicated at top left. The location of the CRBs is shown by gray lines perpendicular to the orbit track. The scale for Poynting flux and Ti are shown to the right of each NH panel.
Current usage metrics show cumulative count of Article Views (full-text article views including HTML views, PDF and ePub downloads, according to the available data) and Abstracts Views on Vision4Press platform.
Data correspond to usage on the plateform after 2015. The current usage metrics is available 48-96 hours after online publication and is updated daily on week days.
Initial download of the metrics may take a while.


