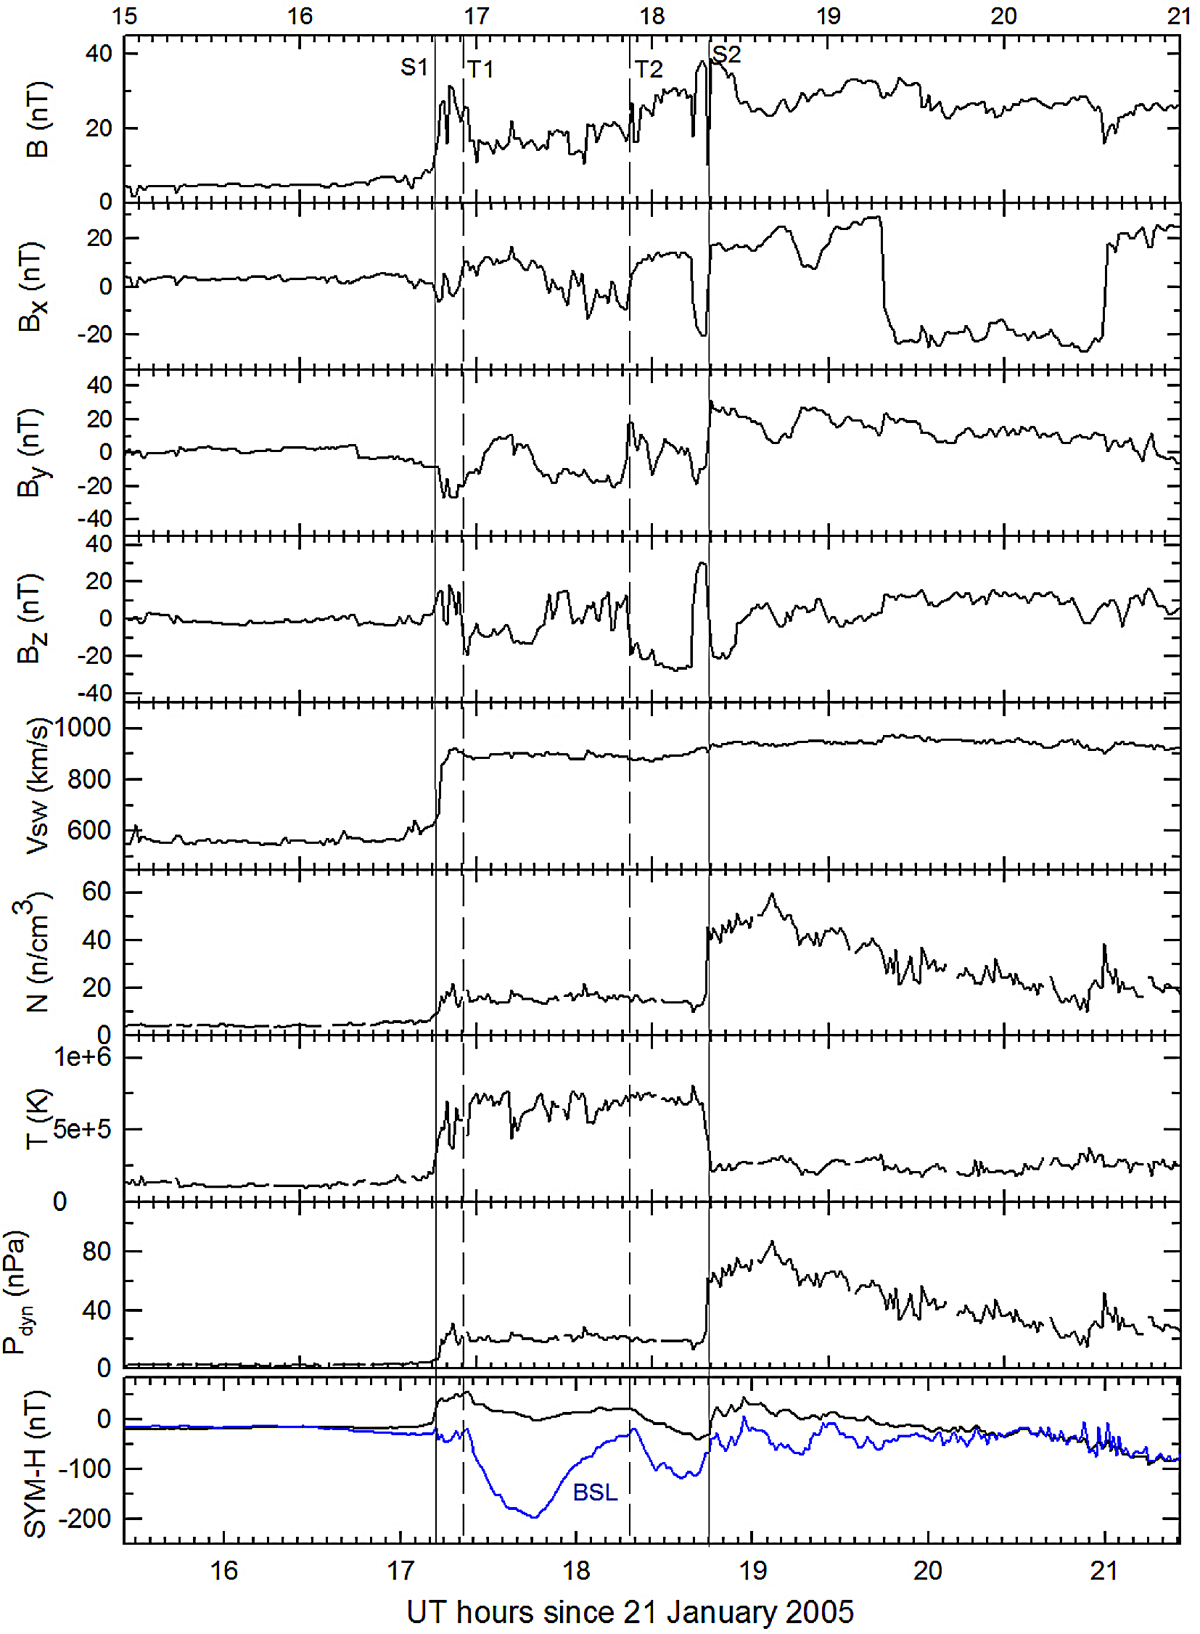
Fig. 8.
Download original image
Interplanetary and geomagnetic data for C05 event (21 January 2005). Interplanetary magnetic field (same panel distribution as four top panels of Fig. 5) and solar wind parameters, Vsw, N, T, in the next three panels, measured at ACE location. Eighth panel shows the dynamic pressure Pdyn. Geomagnetic data (SYM-H index and BSL observatory) are shown in bottom panel. Two different time-lines in horizontal axis have been set: top labels correspond to ACE data (eight top panels) and bottom labels correspond to ground data (bottom panel). Interplanetary plots are shifted 25 min (see text for details) relative to ground plots.Vertical solid lines, S1 and S2, mark shock discontinuities and vertical dashed lines T1 and T2 mark southward turnings of Bz.
Current usage metrics show cumulative count of Article Views (full-text article views including HTML views, PDF and ePub downloads, according to the available data) and Abstracts Views on Vision4Press platform.
Data correspond to usage on the plateform after 2015. The current usage metrics is available 48-96 hours after online publication and is updated daily on week days.
Initial download of the metrics may take a while.