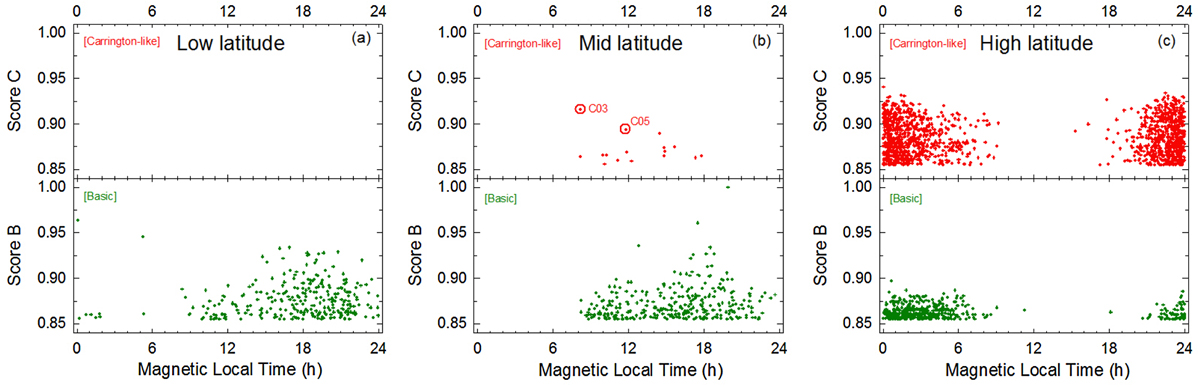
Fig. 9.
Download original image
Event score distribution with respect to the MLT for high- (a), mid- (b) and low- (c) latitude geomagnetic stations. Red plus signs in upper panels correspond to Carrington-like events (group C), and green in bottom panels correspond to group-B events. In upper panel (b) two red circles denote location of the C03 (29 October 2003) and C05 (21 January 2005) events.
Current usage metrics show cumulative count of Article Views (full-text article views including HTML views, PDF and ePub downloads, according to the available data) and Abstracts Views on Vision4Press platform.
Data correspond to usage on the plateform after 2015. The current usage metrics is available 48-96 hours after online publication and is updated daily on week days.
Initial download of the metrics may take a while.