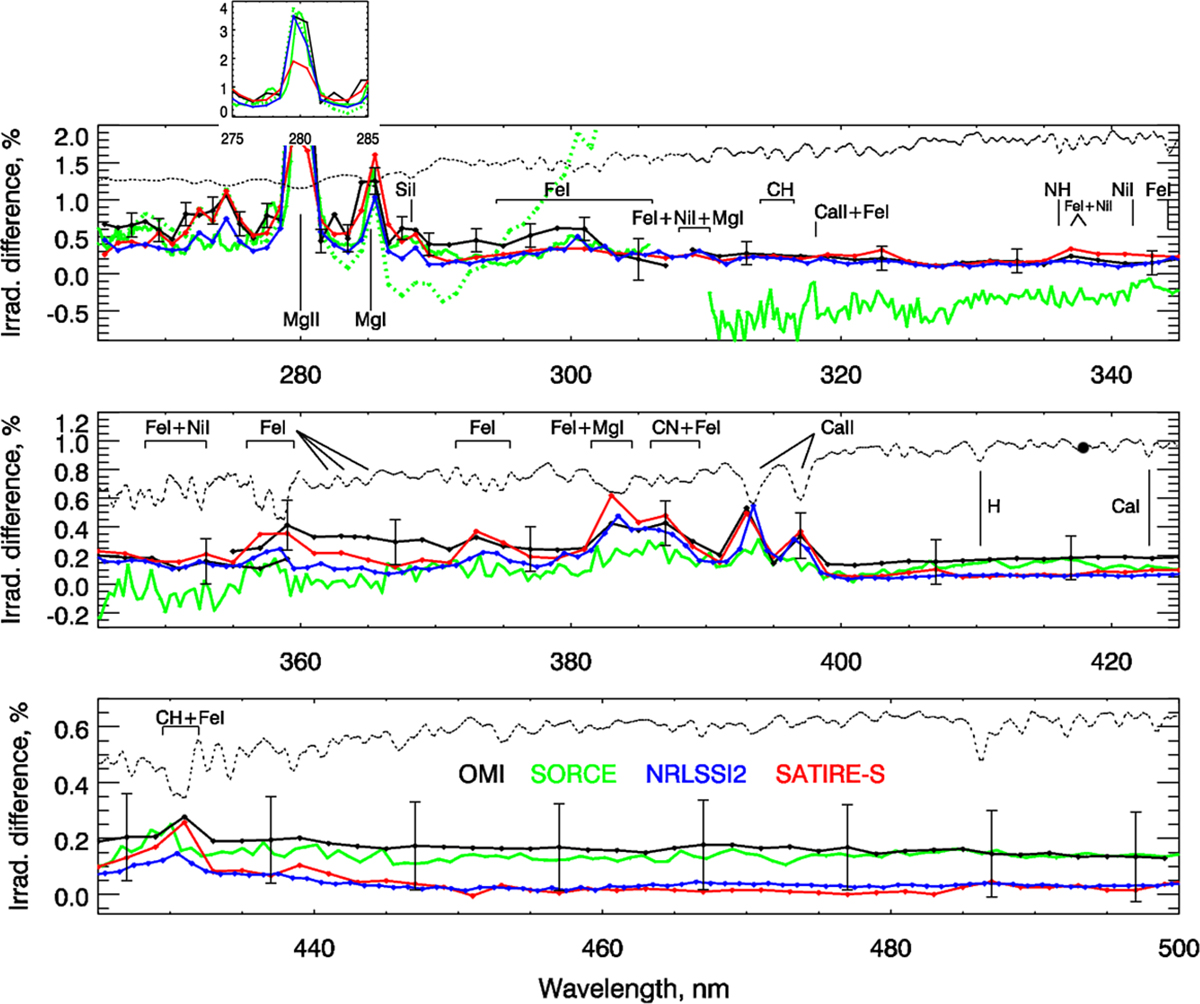
Fig. 1.

Download original image
The averaged and normalized long-term (yy2012–2014 vs. yy2007–2009) SSI changes, as observed by OMI (black lines with representative ±1σ error bars) and predicted by the models. For reference, the scaled OMI solar spectrum is shown as a dotted line, along with the marked major solar lines and line blends. The small inset shows the full-scale variation of the Mg II line doublet. Dotted green lines follow the SORCE SOLSTICE (v15) data; full green lines show the SORCE SIM (v22) set.
Current usage metrics show cumulative count of Article Views (full-text article views including HTML views, PDF and ePub downloads, according to the available data) and Abstracts Views on Vision4Press platform.
Data correspond to usage on the plateform after 2015. The current usage metrics is available 48-96 hours after online publication and is updated daily on week days.
Initial download of the metrics may take a while.


