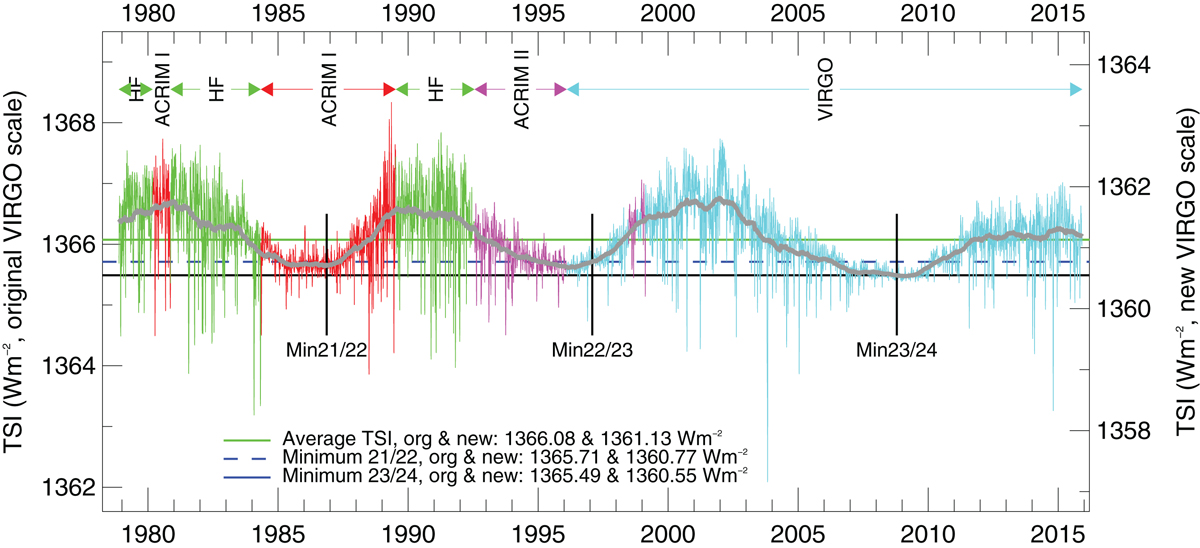
Fig. 2.

Download original image
The PMOD TSI composite shows peak-to-peak TSI variability of ~0.1% in each of the three solar cycles observed during the space-borne measurement record, with that variability being in phase with solar activity. The colors indicate the binary selections of different instruments used in the creation of the composite. The right-hand vertical scale indicates the more accurate currently-accepted absolute value. (“HF,” short for its creators Hickey and Friedan, is a name used by some authors for the NIMBUS7/ERB instrument in Fig. 1) (Figure is courtesy of the VIRGO team).
Current usage metrics show cumulative count of Article Views (full-text article views including HTML views, PDF and ePub downloads, according to the available data) and Abstracts Views on Vision4Press platform.
Data correspond to usage on the plateform after 2015. The current usage metrics is available 48-96 hours after online publication and is updated daily on week days.
Initial download of the metrics may take a while.


