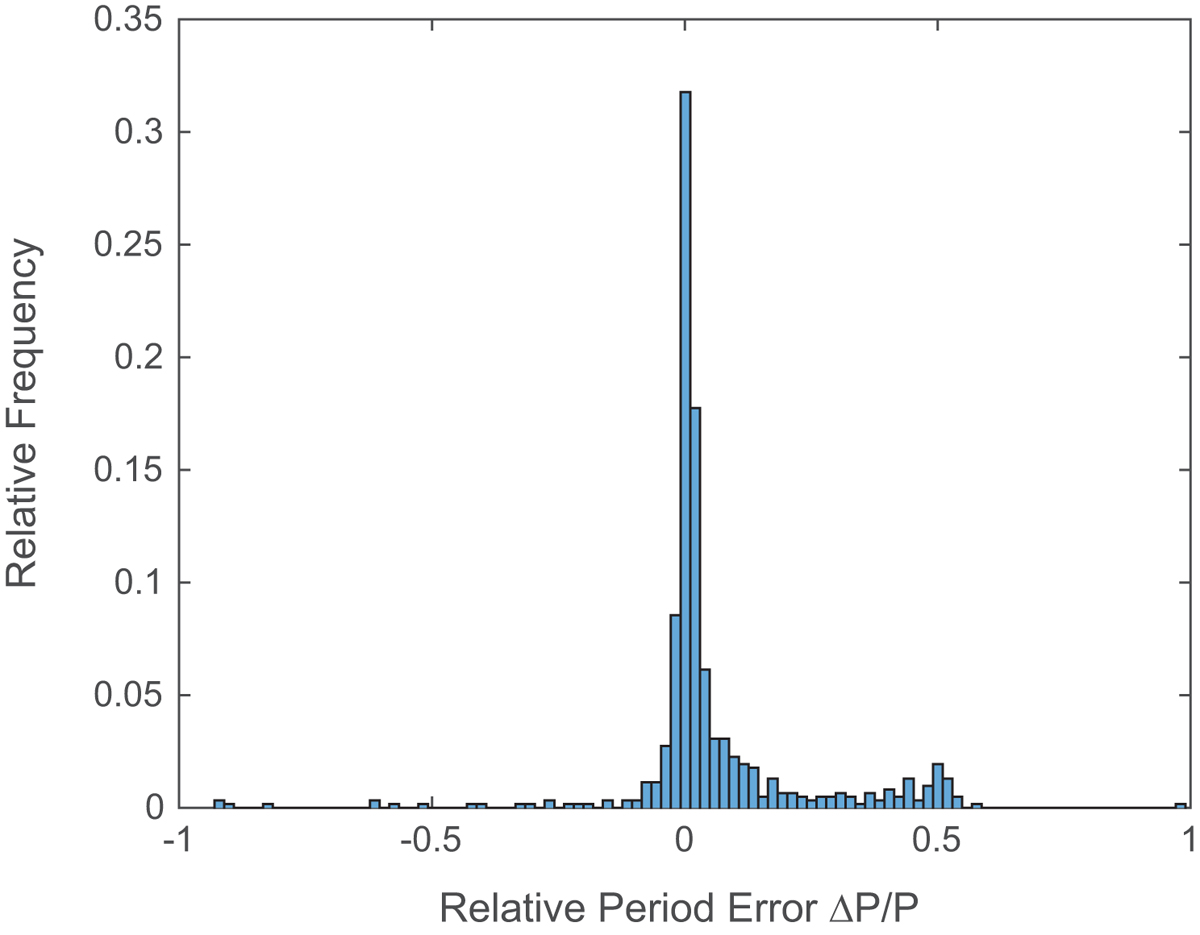
Fig. 4.
Download original image
A histogram of the relative differences between the rotational periods derived in this work and those previously derived by McQuillan et al. (2014) for targets with SNR > 10 appearing in both works. Differences are in the sense of P − PMcQuillan, and the standard deviation of the central peak is 6.9%. The secondary peak is due to stars for which our period is twice as long as that reported by McQuillan et al. (2014); see text for further discussion.
Current usage metrics show cumulative count of Article Views (full-text article views including HTML views, PDF and ePub downloads, according to the available data) and Abstracts Views on Vision4Press platform.
Data correspond to usage on the plateform after 2015. The current usage metrics is available 48-96 hours after online publication and is updated daily on week days.
Initial download of the metrics may take a while.