Fig. 3.
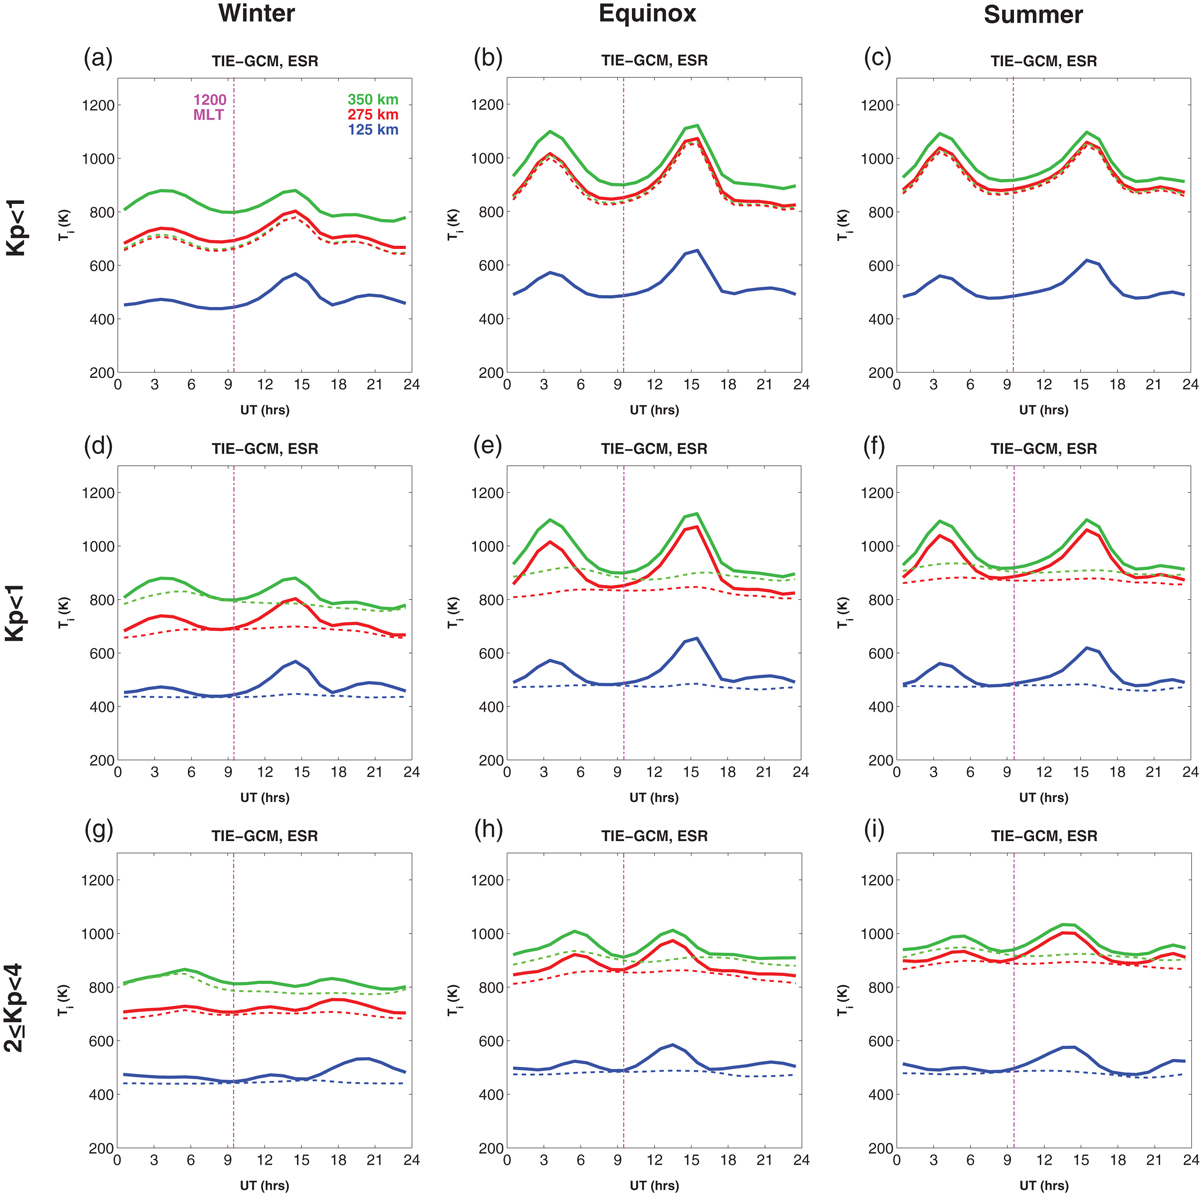
Download original image
The results of TIE-GCM numerical experiments. In Panels (a–c), the solid lines show the same variables as Panels (a–c) of Figure 2, while the dashed lines show the corresponding results calculated using Eq. (2) that neglects the effect of electron heating. In Panels (d–i), the solid lines show the same variables as Panels (a–f) of Figure 2, while the dashed lines show the corresponding results calculated using Eq. (3) that neglects the effect of ion-neutral frictional heating. Of note, the dashed blue line in Panels (a–c) closely overlaps with the solid blue line. Also, the dashed green line in Panels (a–c) is partly hidden by the red lines.
Current usage metrics show cumulative count of Article Views (full-text article views including HTML views, PDF and ePub downloads, according to the available data) and Abstracts Views on Vision4Press platform.
Data correspond to usage on the plateform after 2015. The current usage metrics is available 48-96 hours after online publication and is updated daily on week days.
Initial download of the metrics may take a while.