Fig. 1.
Download original image
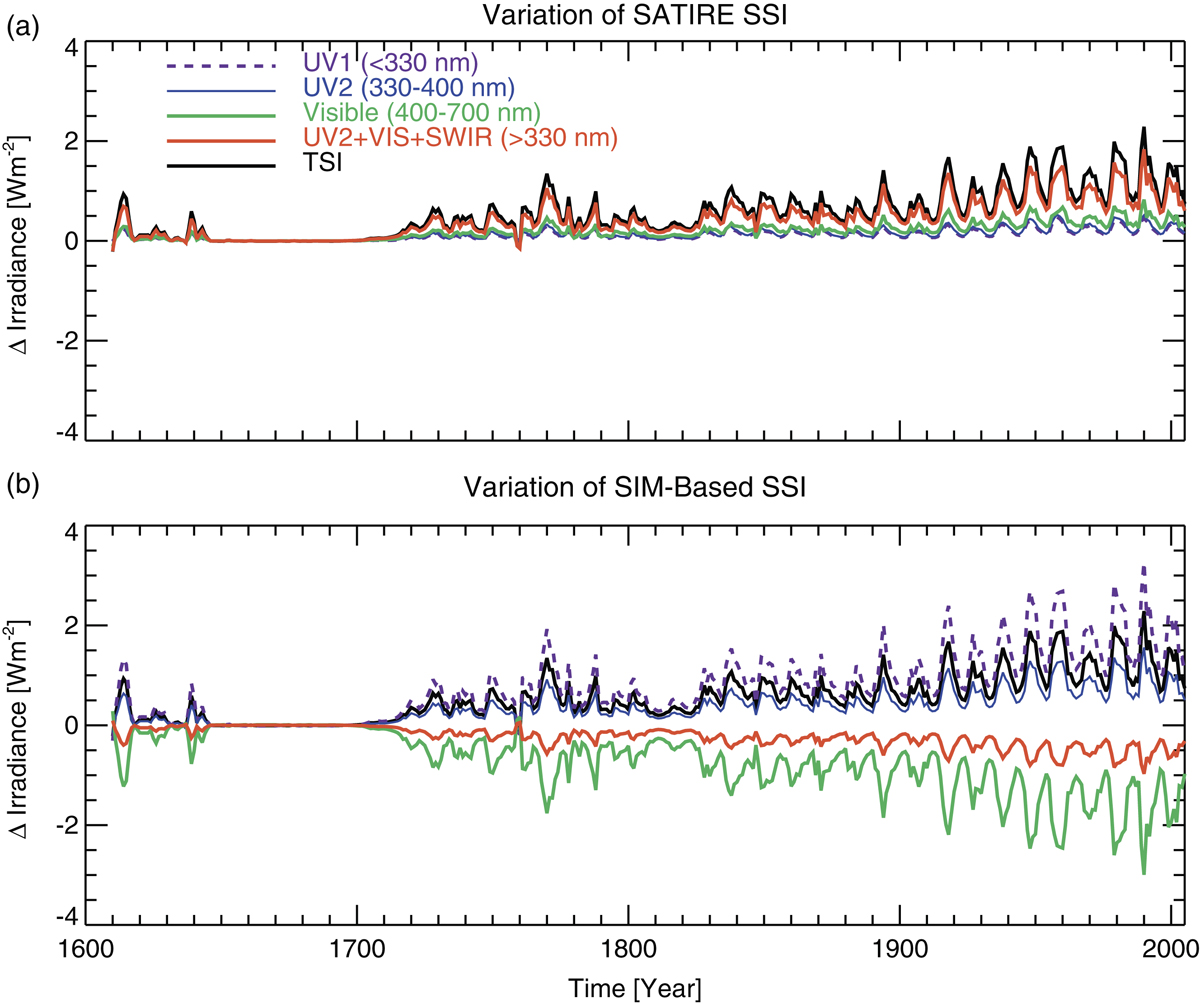
(a) SATIRE modeled in-phase SSI variations for UV1 (λ < 330 nm), UV2 (330 < λ < 400 nm), visible (400 < λ < 700 nm), SW radiative forcing proxy (λ > 330 nm), and TSI relative to year 1660; (b) similar to (a) but for SIM-based irradiance variations. Note that for the same TSI variations, the amplitude of SIM-based UV (λ < 330 nm) irradiance variation is about four times as large as that for SATIRE modeled SSI, SIM-based visible irradiance varies out-of-phase with the UV irradiance, the SIM-based solar forcing proxy is out-of-phase with TSI. From Maunder Minimum to the recent solar minima (1900–2005), TSI increases by 0.72 W m−2. In the modern solar maximum period (1900–2005), the TSI 11-year cycle variability is about 0.83 W m−2.
Current usage metrics show cumulative count of Article Views (full-text article views including HTML views, PDF and ePub downloads, according to the available data) and Abstracts Views on Vision4Press platform.
Data correspond to usage on the plateform after 2015. The current usage metrics is available 48-96 hours after online publication and is updated daily on week days.
Initial download of the metrics may take a while.