Fig. 3.
Download original image
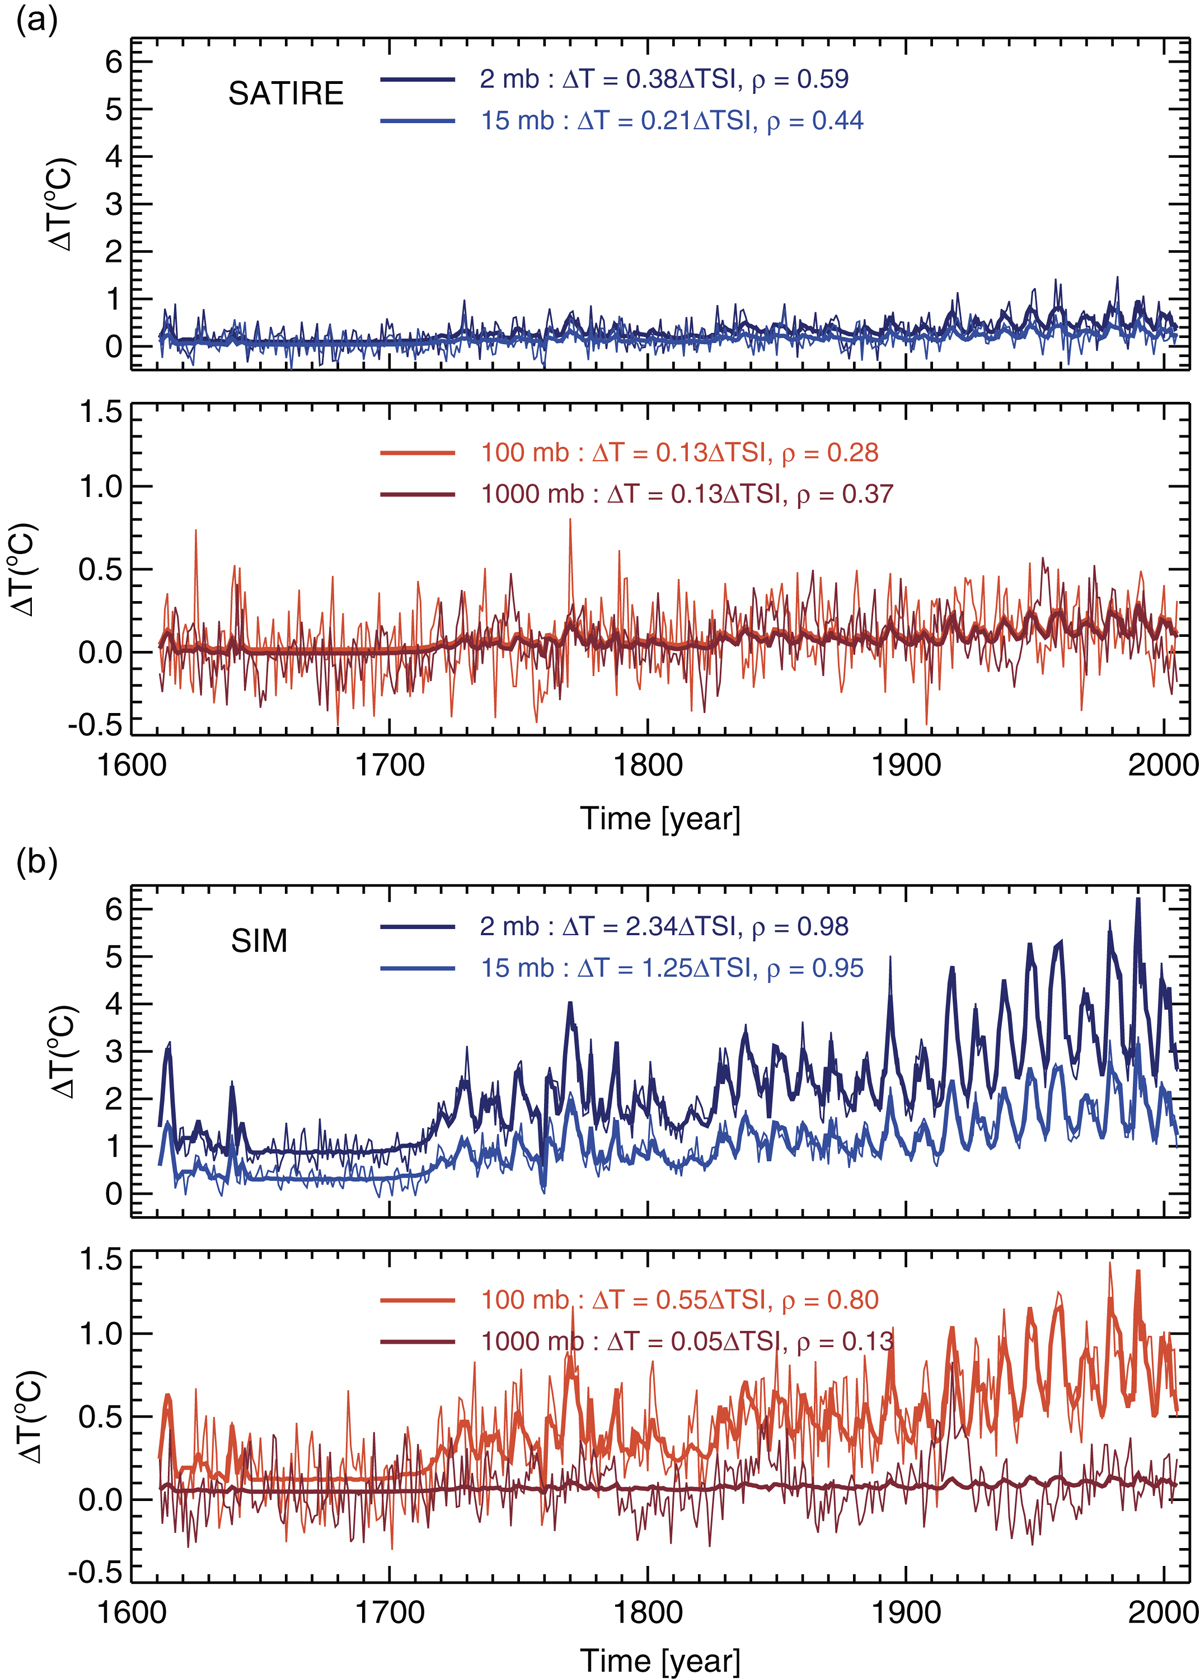
(a) Simulated global averaged annual mean temperature variations (thinner lines) for SATIRE spectral solar forcing and the responses extracted from the regression analysis of the modeled data (thicker lines) for different altitudes. Correlation coefficients between modeled variation and response from regression analysis are indicated. (b) Simulated global averaged annual mean temperature variations (thinner lines) for SIM-based spectral solar forcing and the responses extracted from the regression analysis of the modeled data (thicker lines) for different altitudes. Correlation coefficients between modeled variation and response from regression analysis are indicated.
Current usage metrics show cumulative count of Article Views (full-text article views including HTML views, PDF and ePub downloads, according to the available data) and Abstracts Views on Vision4Press platform.
Data correspond to usage on the plateform after 2015. The current usage metrics is available 48-96 hours after online publication and is updated daily on week days.
Initial download of the metrics may take a while.