Fig. 4.
Download original image
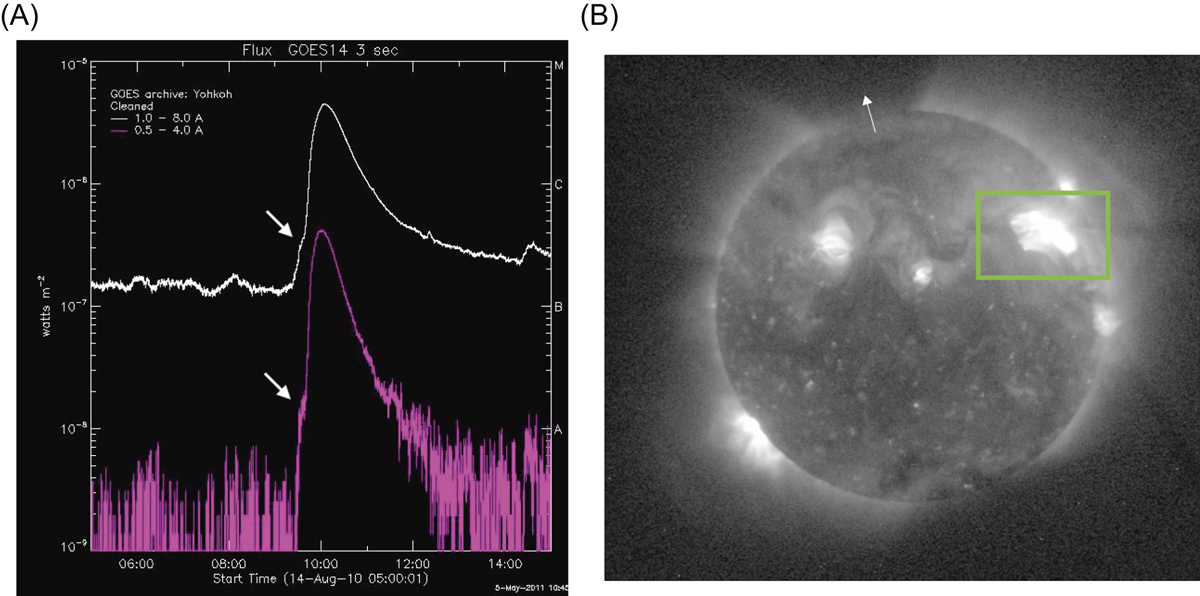
(A) The GOES X-ray flux measurements on August 14, 2010 show a C4.4 flare at the time of the eruption. The arrows indicate a shoulder in the rising phase around 09:30 UT, which corresponds in time to the start of the filament eruption in the southern region. (B) The associated flare imaged by the Solar X-ray Imager on the GOES-14 spacecraft at 09:49 UT. The flaring region is bounded by the green box.
Current usage metrics show cumulative count of Article Views (full-text article views including HTML views, PDF and ePub downloads, according to the available data) and Abstracts Views on Vision4Press platform.
Data correspond to usage on the plateform after 2015. The current usage metrics is available 48-96 hours after online publication and is updated daily on week days.
Initial download of the metrics may take a while.