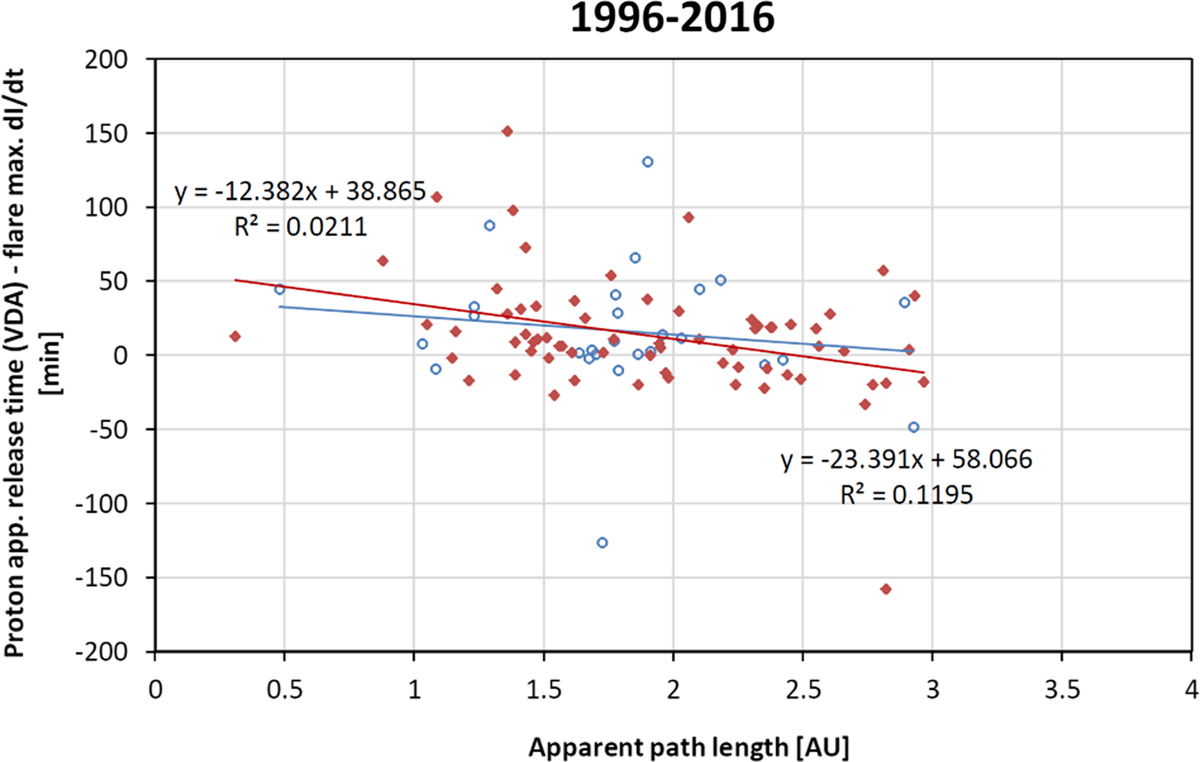
Fig. 10.

Download original image
Difference of apparent proton release time (as obtained from VDA) and the time derivative maximum of the soft X-ray intensity as a function of VDA apparent path length s for the catalogued events, with all data points that have s > 3 AU or the absolute value of the time difference in excess of 200 min. The red symbols represent solar cycle 23 (1996–2008) events, and the blue symbols represent solar cycle 24 (2009–2016) events. The lower equations refer to the linear fit for solar cycle 23 events, the upper ones to the linear fit for solar cycle 24 events.
Current usage metrics show cumulative count of Article Views (full-text article views including HTML views, PDF and ePub downloads, according to the available data) and Abstracts Views on Vision4Press platform.
Data correspond to usage on the plateform after 2015. The current usage metrics is available 48-96 hours after online publication and is updated daily on week days.
Initial download of the metrics may take a while.


