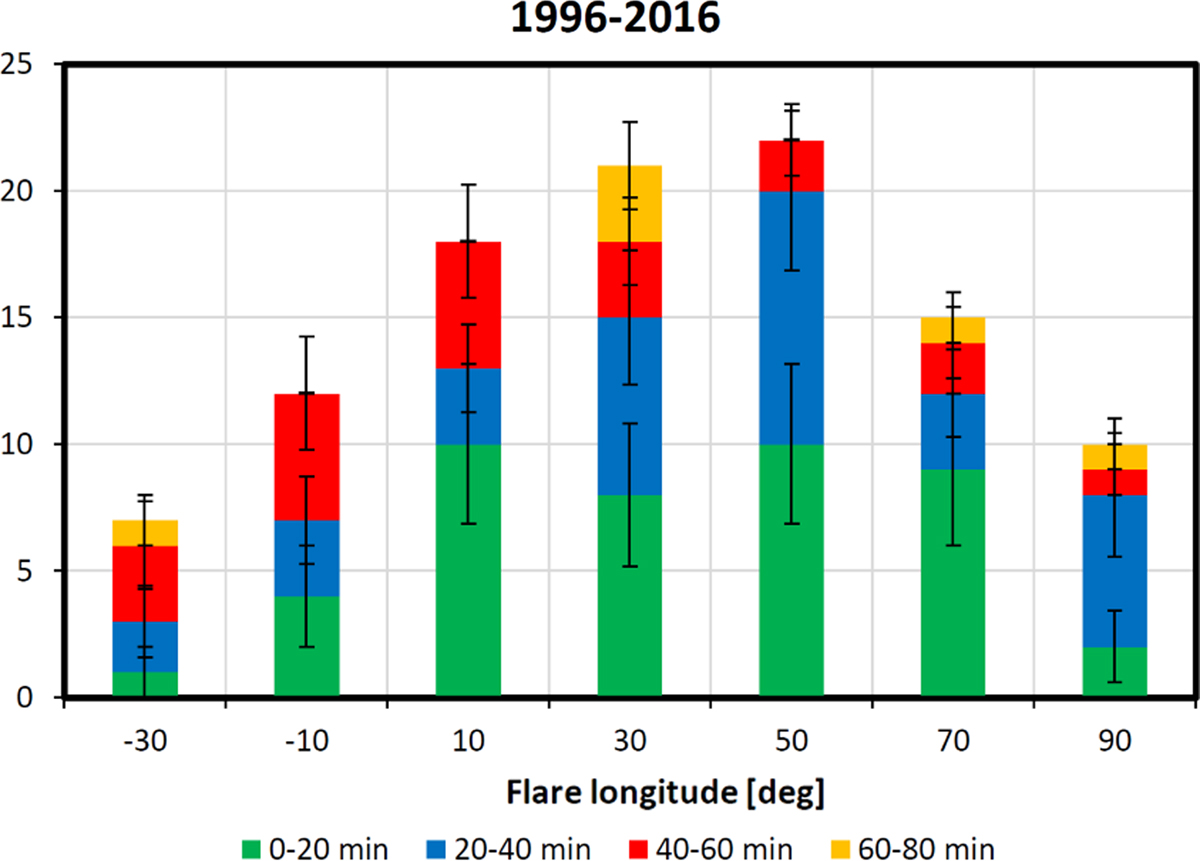
Fig. 6.

Download original image
The distribution of the 1996–2016 events with the location of origin more westerly than 30E and the difference between apparent electron release time (TSA) and the time derivative maximum of X-ray intensity within the range of [0, 80] minutes. The error bars denote the statistical error, and the values on the abscissa (eastern longitudes expressed as negative, western longitudes as positive) denote the lower limit of each longitude bin. The last bin contains the western over-the-limb events.
Current usage metrics show cumulative count of Article Views (full-text article views including HTML views, PDF and ePub downloads, according to the available data) and Abstracts Views on Vision4Press platform.
Data correspond to usage on the plateform after 2015. The current usage metrics is available 48-96 hours after online publication and is updated daily on week days.
Initial download of the metrics may take a while.


