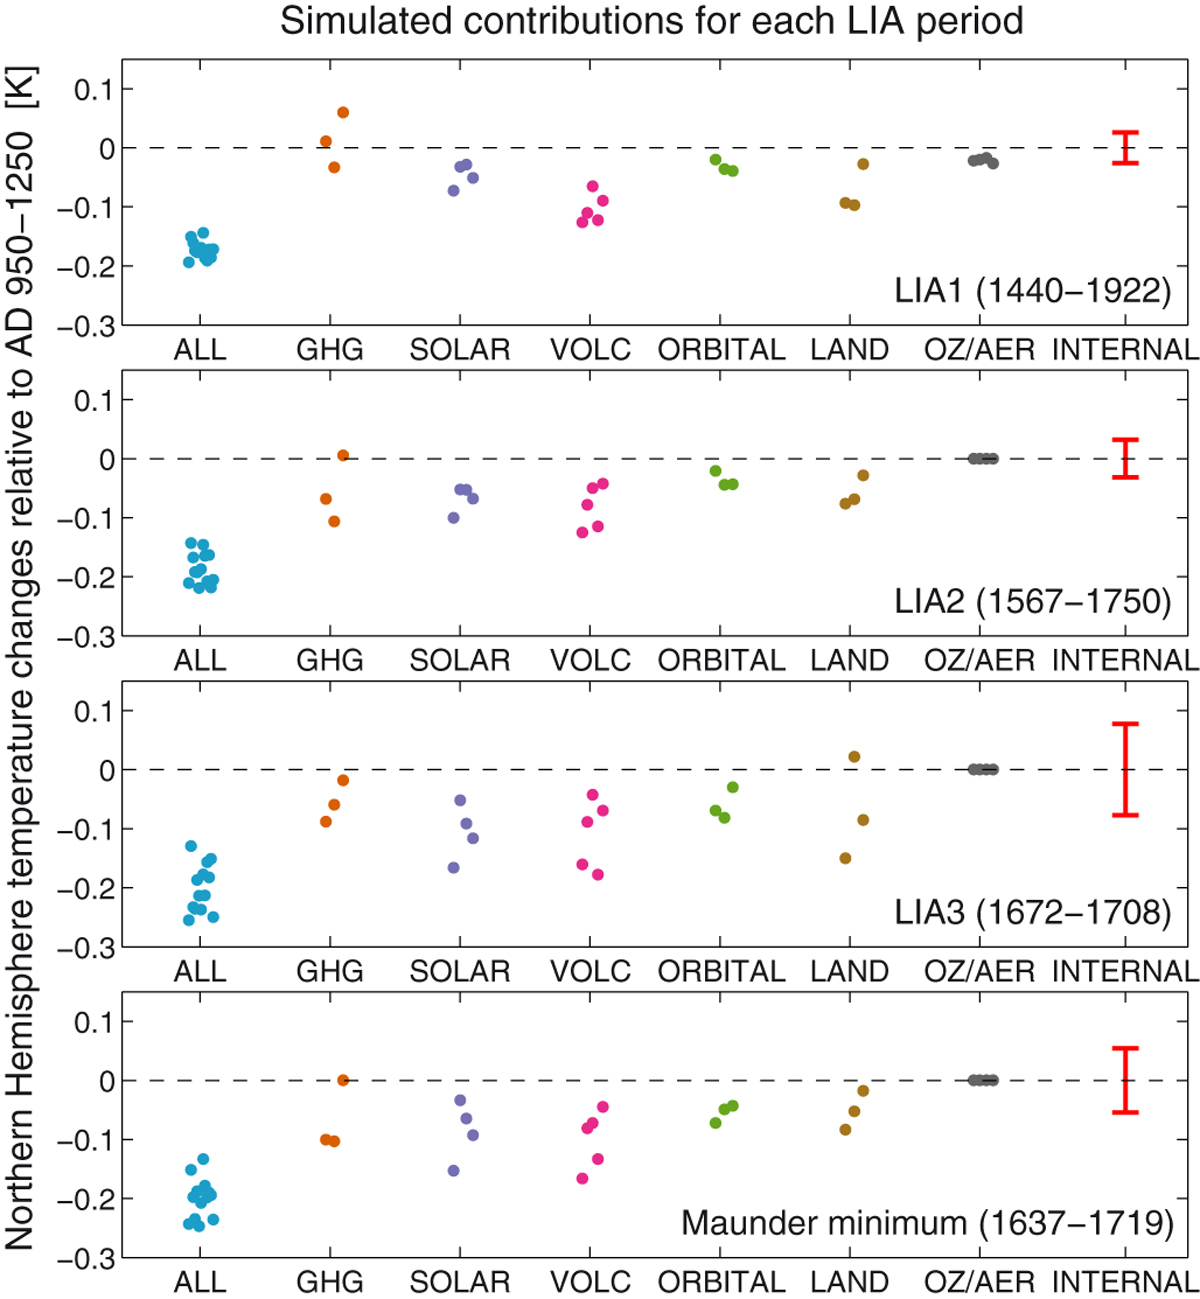
Fig. 4

Download original image
Simulated northern hemisphere temperature changes, relative to AD 950–1250, using the CESM-LME global climate model (data from Otto-Bliesner et al., 2016). Temperature changes have been averaged over periods of interest for each simulation, representing the contribution of different factors to the overall simulated cooling. The temperature anomalies are different for different ensemble members and the differences between them for each simulation type are due to the internal fluctuations in climate, the typical size of which are indicated by the red bars, which are larger for shorter averaging periods.
Current usage metrics show cumulative count of Article Views (full-text article views including HTML views, PDF and ePub downloads, according to the available data) and Abstracts Views on Vision4Press platform.
Data correspond to usage on the plateform after 2015. The current usage metrics is available 48-96 hours after online publication and is updated daily on week days.
Initial download of the metrics may take a while.


