Fig. 10
Download original image
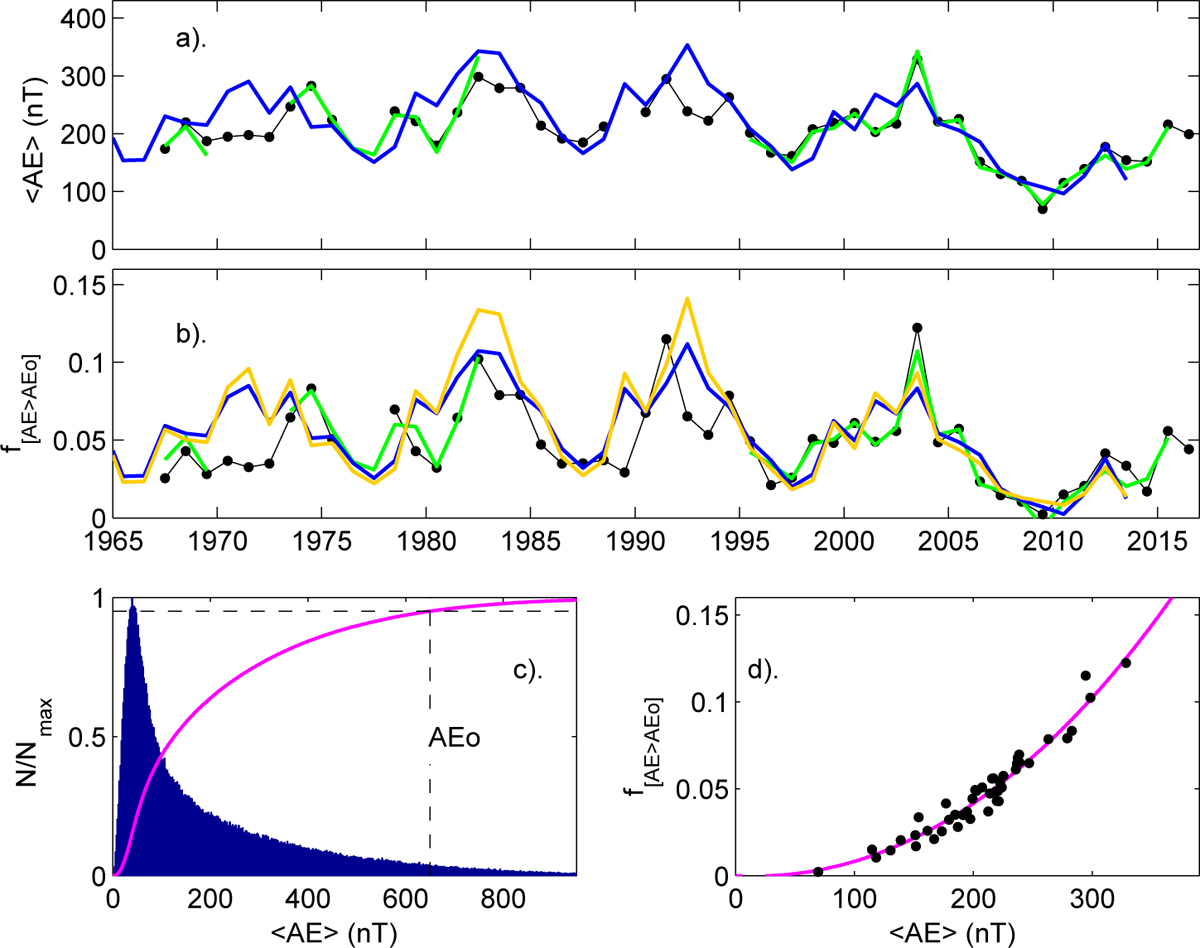
Same as Figure 7 for the AE auroral electrojet geomagnetic index. The blue line in (a) is the modelled AE variation and the addition orange and blue lines are the two modelled estimates of f[AE > AEo]. The green lines are the variations predicted using annual estimates of Pα from interplanetary observations for years when data availability f > 0.5. Predicted values use the linear regressions shown in Figure 11. The histogram in (c) is for the 667604 hourly samples available between 1964 and 2016 (inclusive) and the scatter plot in (d) is for the 47 of the 53 years for which data availability f exceeds 0.75.
Current usage metrics show cumulative count of Article Views (full-text article views including HTML views, PDF and ePub downloads, according to the available data) and Abstracts Views on Vision4Press platform.
Data correspond to usage on the plateform after 2015. The current usage metrics is available 48-96 hours after online publication and is updated daily on week days.
Initial download of the metrics may take a while.