Fig. 2
Download original image
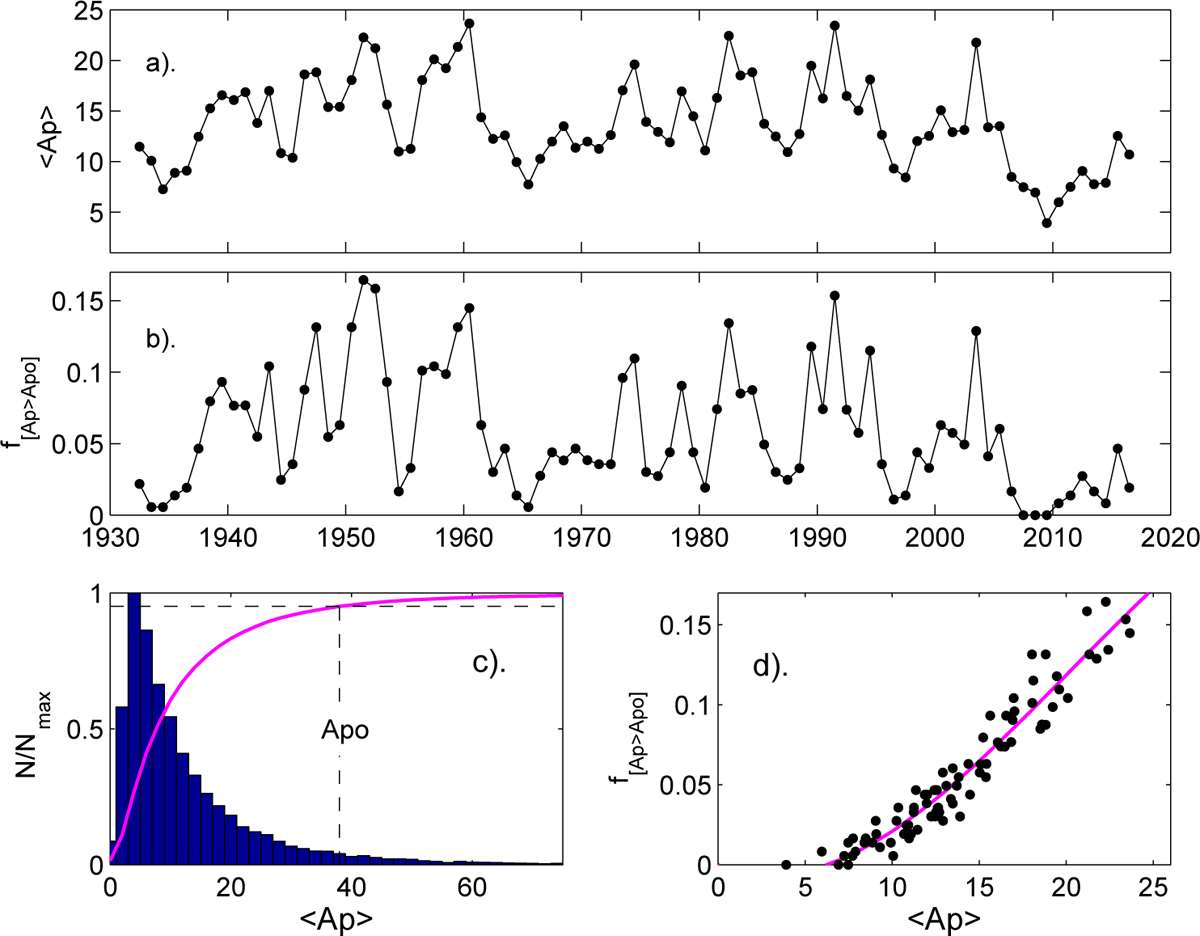
. Analysis of the Ap geomagnetic index. (a) The variation of annual means, <Ap>τ = 1 yr. (b) The fraction of time in each year when daily means of Ap exceeds the 95 percentile of the overall distribution, Apo = 38, f[Ap > Apo]. (c) The blue histogram shows the probability distribution function (pdf) of daily Ap means <Ap>τ = 1 day in bins that are 2 index values in width (N is the number of the total of 31 100 samples in each bin and Nmax is the peak value of N) and the mauve line is the cumulative probability distribution (cdf) from which the 95 percentile Apo is defined. (d) The scatter plot of the 85 annual values of f[Ap > Apo] as a function of <Ap>τ = 1 yr to which the mauve line is the 3rd-order polynomial fit.
Current usage metrics show cumulative count of Article Views (full-text article views including HTML views, PDF and ePub downloads, according to the available data) and Abstracts Views on Vision4Press platform.
Data correspond to usage on the plateform after 2015. The current usage metrics is available 48-96 hours after online publication and is updated daily on week days.
Initial download of the metrics may take a while.