Fig. 6
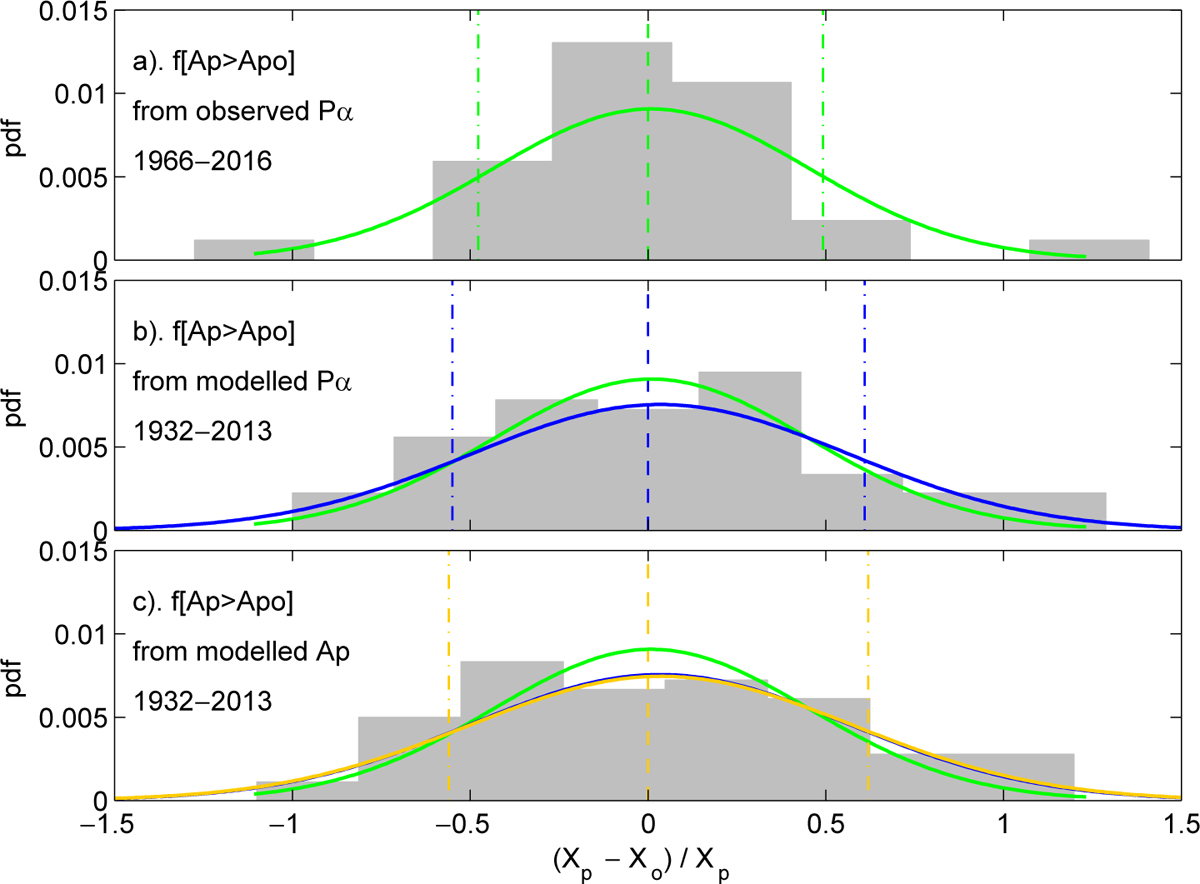
Download original image
Analysis of fit residuals for the annual f[Ap > Apo] reconstructions shown in Figure 4b, in the same format as Figure 5. In all panels Xo is observed f[Ap > Apo] and Xp is predicted values. (a) For Xp = f[Ap > Apo] predicted using the available (f > 0.5) interplanetary Pα values using the regression in Figure 3b: the fitted green distribution giving upper and lower 1−σ points shown by the green vertical dot-dash lines. (b) For Xp = f[Ap > Apo] predicted using reconstructed interplanetary Pα values using the regression shown in Figure 3b: the fitted blue distribution giving upper and lower 1−σ points are shown by the blue vertical dot-dash lines. (c) For Xp = f[Ap > Apo] predicted using reconstructed Ap values shown in blue in Figure 4a, using the regression shown in Figure 2d: the fitted orange distribution giving upper and lower 1−σ points shown by the orange dot-dash lines.
Current usage metrics show cumulative count of Article Views (full-text article views including HTML views, PDF and ePub downloads, according to the available data) and Abstracts Views on Vision4Press platform.
Data correspond to usage on the plateform after 2015. The current usage metrics is available 48-96 hours after online publication and is updated daily on week days.
Initial download of the metrics may take a while.