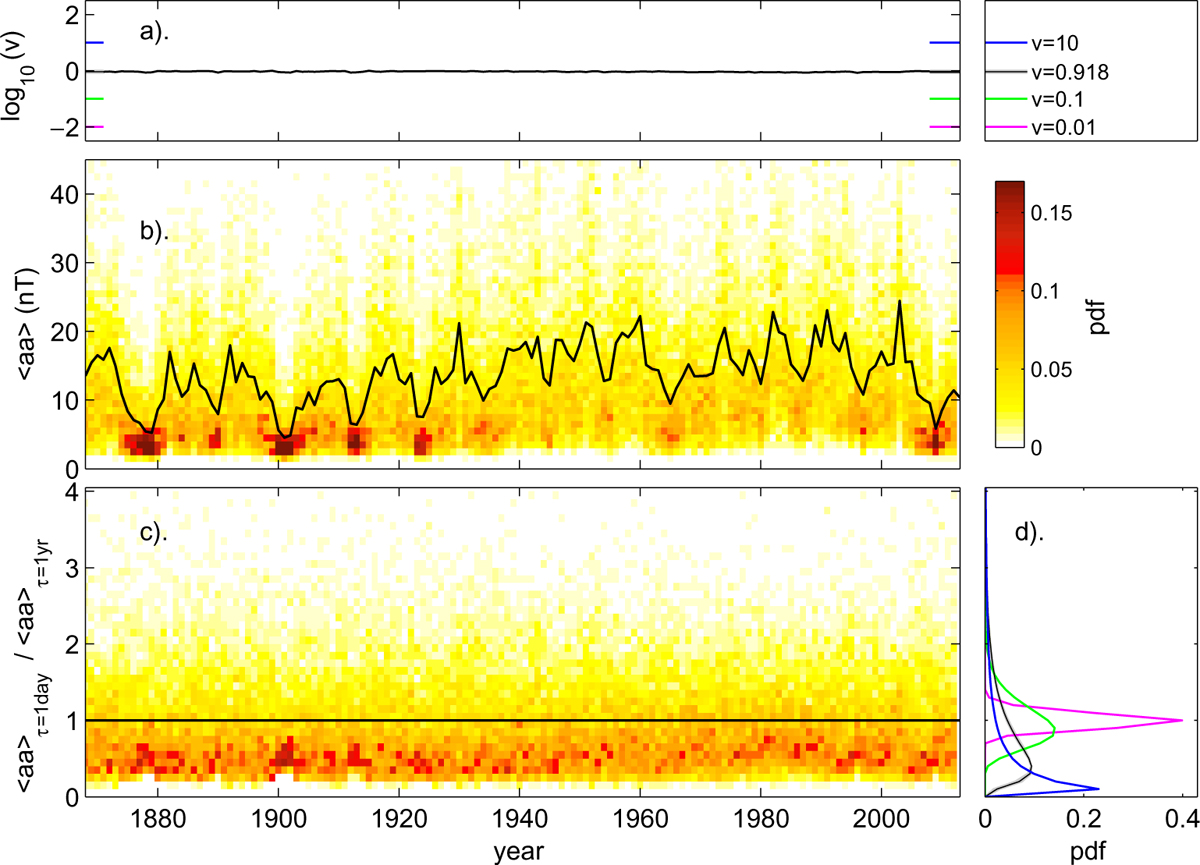
Fig. 8
Download original image
Analysis of annual distributions of daily aa values, <aa>τ = 1 day, of over 1868–2013. All aa values have been corrected as described by Lockwood et al.(2014a). (a) The logarithm of the variance log10(v) of the fitted lognormal distributions to the distributions of <aa>τ = 1 day/<aa>τ = 1 yr shown in (c). The mean of the 146 annual values of the fitted v is <v> = 0.918 and its standard deviation is σv = 0.035, meaning that v is constant to better than 4% at the 1−σ level. (Note that lognormal distributions are often described by the logarithmic moments μ and σ : m = 1 and v = 0.918 correspond to μ = −0.326 and σ = 0.807). (b) Annual probability distribution function (pdfs) of daily means are colour coded and the black line shows the annual means, <aa >τ = 1 yr. Probabilities are evaluated in bins of aa that are 1 nT wide. (c) Annual probability distribution function (pdfs) of normalised daily aa, <aa >τ = 1 day/<aa >τ = 1 yr, colour-coded using the same scale as (b) and the black gives the annual means of this normalised aa which is, by definition, unity. Probabilities are evaluated in bins of normalised aa that are 0.1 wide. (d) Example pdfs for lognormal distributions with mean values of unity (m = 1) with (mauve) v = 0.01; (green) v = 0.01; (black) v = <v> = 0.918 and (blue) v = 10, as also marked in panel (a). Underneath the distribution plotted in black for v = <v> are plotted, in grey, the distributions for the 146 fitted v values for each year: that they are almost indistinguishable in this plot underlines how constant the normalised distributions are over the 146 years of the aa data.
Current usage metrics show cumulative count of Article Views (full-text article views including HTML views, PDF and ePub downloads, according to the available data) and Abstracts Views on Vision4Press platform.
Data correspond to usage on the plateform after 2015. The current usage metrics is available 48-96 hours after online publication and is updated daily on week days.
Initial download of the metrics may take a while.