Fig. 4
Download original image
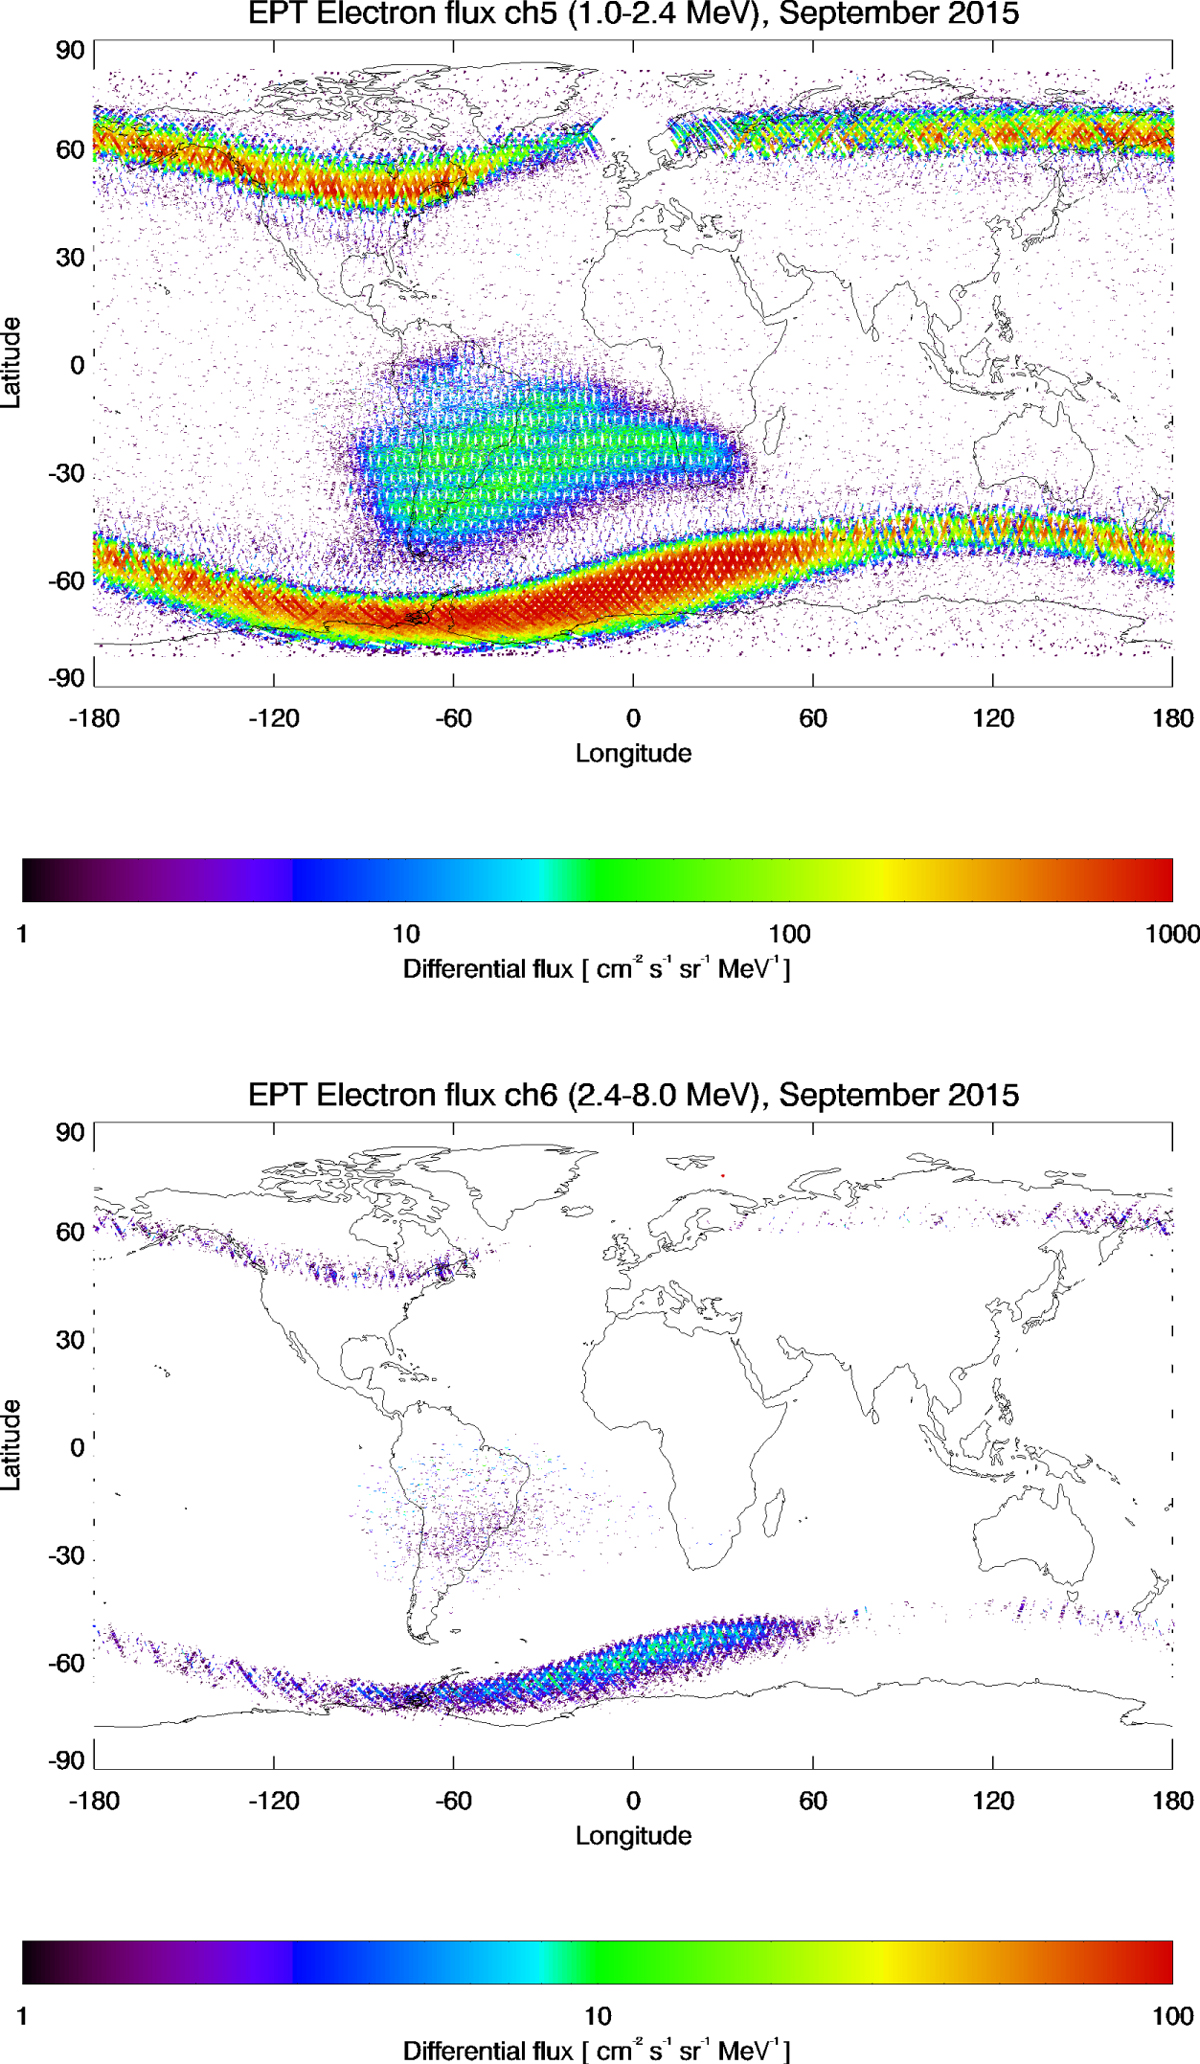
Maps of the EPT electron detections for channels 5 (1–2.4 MeV, top graph) and 6 (2.4–8 MeV, bottom graph). The channel 5 detects electrons at the same locations as LYRA but it also detects electrons in the South Atlantic Anomaly (SAA) area. The channel 6 map is more similar to the maps of Figure 3 since the SAA is far less prominent, while a significant amount of detections remains around the L = 6 area.
Current usage metrics show cumulative count of Article Views (full-text article views including HTML views, PDF and ePub downloads, according to the available data) and Abstracts Views on Vision4Press platform.
Data correspond to usage on the plateform after 2015. The current usage metrics is available 48-96 hours after online publication and is updated daily on week days.
Initial download of the metrics may take a while.