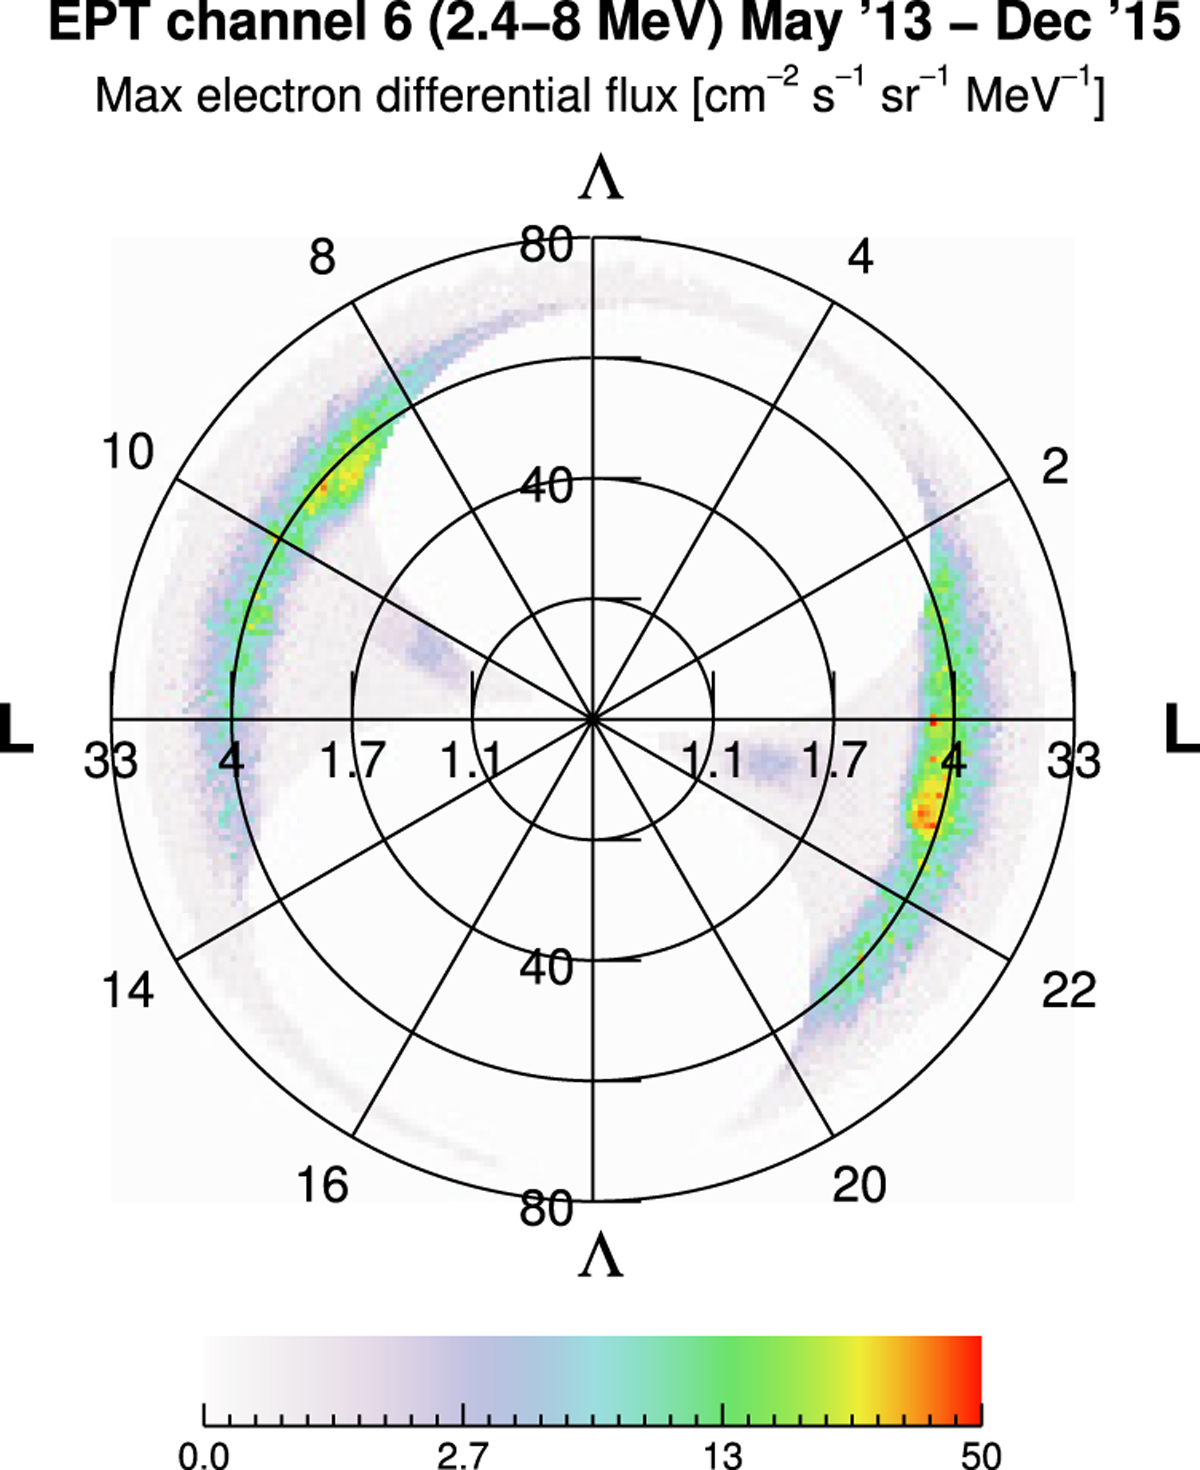
Fig. 7

Download original image
The maximum electron intensities recorded by channel 6 of the EPT/PROBA-V instrument plotted on a MLT vs Λ/L polar diagram. Similarly to the polar diagram of Figure 5, the radius r is proportional to Λ and the angle φ to the MLT. The y-axis is marked with invariant latitude, while the x-axis in L-shell values. The flux scale is logarithmic, where the white areas are outside PROBA-V's orbit, the faint purple is noise.
Current usage metrics show cumulative count of Article Views (full-text article views including HTML views, PDF and ePub downloads, according to the available data) and Abstracts Views on Vision4Press platform.
Data correspond to usage on the plateform after 2015. The current usage metrics is available 48-96 hours after online publication and is updated daily on week days.
Initial download of the metrics may take a while.


