Open Access
Fig. 4
Download original image
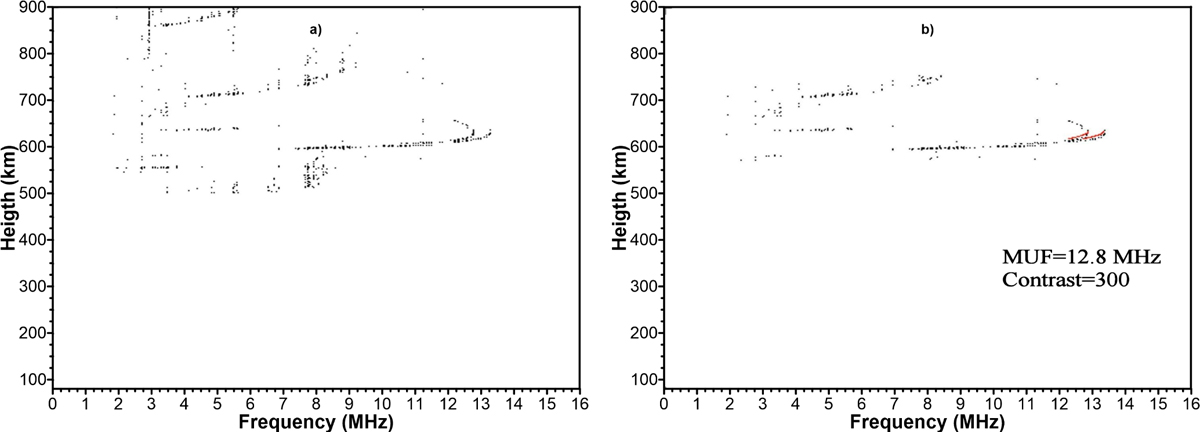
Panel (a) shows the matrix representation of the ionogram registered on 21/09/2016 at 18:05 UT, after filtering out the echoes with h' < 500 km and with ϑ < 30°. Panel (b) represents the same oblique ionogram automatically scaled by OIASA, after a filtering procedure to reduce the image noise.
Current usage metrics show cumulative count of Article Views (full-text article views including HTML views, PDF and ePub downloads, according to the available data) and Abstracts Views on Vision4Press platform.
Data correspond to usage on the plateform after 2015. The current usage metrics is available 48-96 hours after online publication and is updated daily on week days.
Initial download of the metrics may take a while.