Fig. 10
Download original image
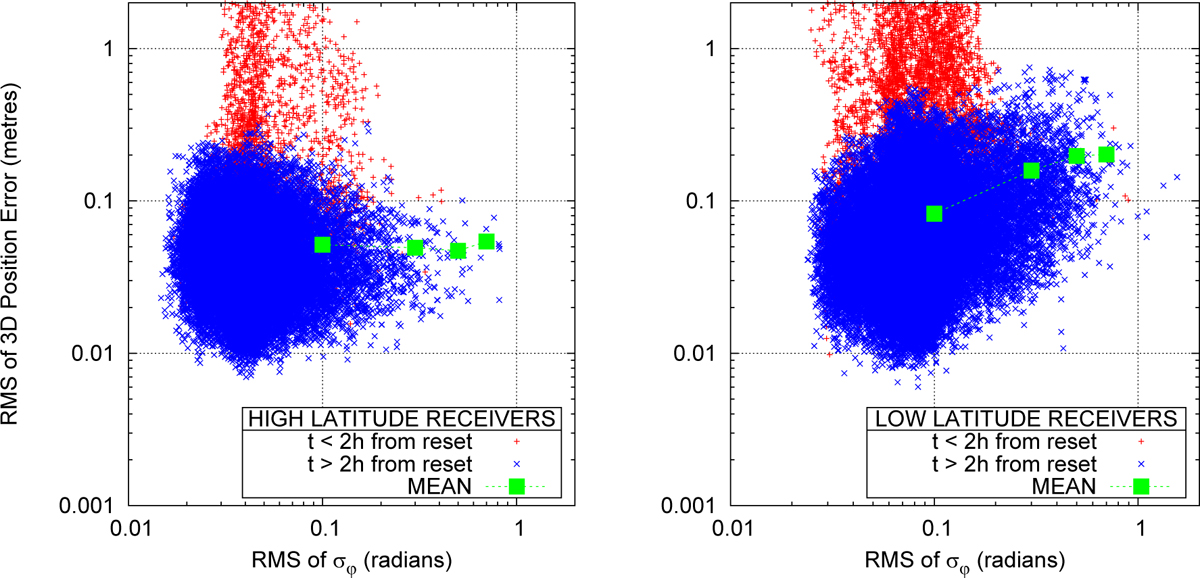
Relationship between the 3D-position error and the ionospheric scintillation for the 6 IGS receivers shown in Table 1, high latitude receivers are compared in the left panel and low latitude receivers are compared in the right panel. The comparison extends for more than 2 weeks of high ionospheric activity (see Sect. 2). The red points correspond to the first 2 h after the daily reset (convergence period) while the blue points correspond to the comparison during the rest of the day. The green squares depict the mean values of the 3D position error per bins of σϕ (0.1, 0.3, 0.5 and greater than 0.6).
Current usage metrics show cumulative count of Article Views (full-text article views including HTML views, PDF and ePub downloads, according to the available data) and Abstracts Views on Vision4Press platform.
Data correspond to usage on the plateform after 2015. The current usage metrics is available 48-96 hours after online publication and is updated daily on week days.
Initial download of the metrics may take a while.