Fig. 2
Download original image
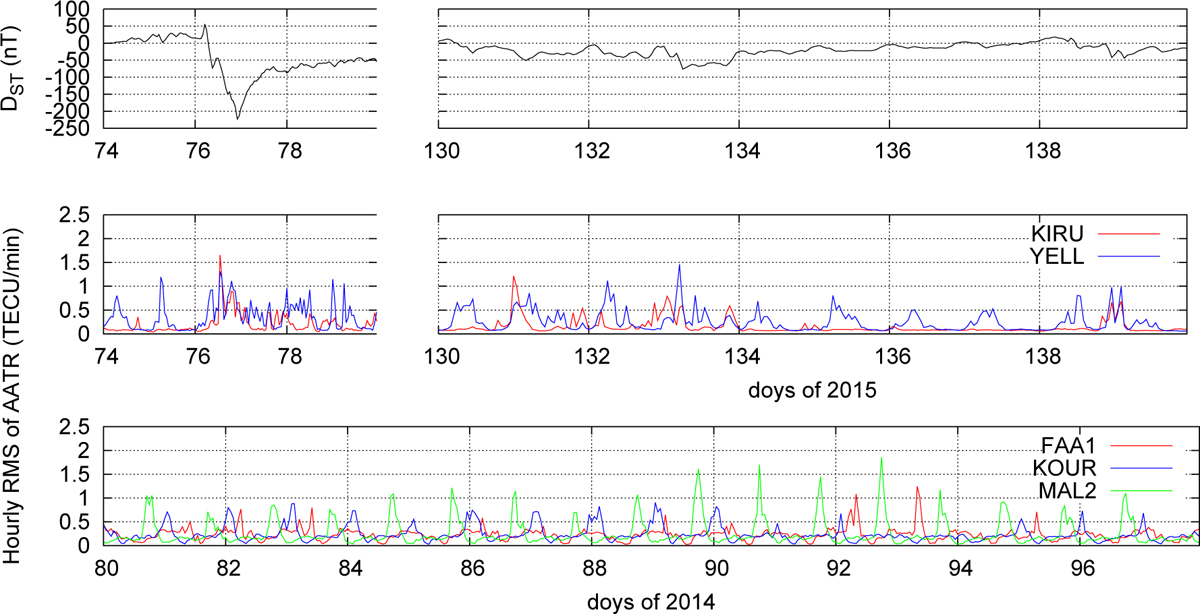
Magnetic and ionospheric activity during the periods studied in this work. Top panel: DST during the period when the high latitude data is analysed in 2015. Middle panel: AATR for the high latitude receivers (KIRU and YELL). Bottom panel: AATR for the low latitude receivers (KOUR, MAL2 and FAA1) during the analysed period in 2014.
Current usage metrics show cumulative count of Article Views (full-text article views including HTML views, PDF and ePub downloads, according to the available data) and Abstracts Views on Vision4Press platform.
Data correspond to usage on the plateform after 2015. The current usage metrics is available 48-96 hours after online publication and is updated daily on week days.
Initial download of the metrics may take a while.