Fig. 13
Download original image
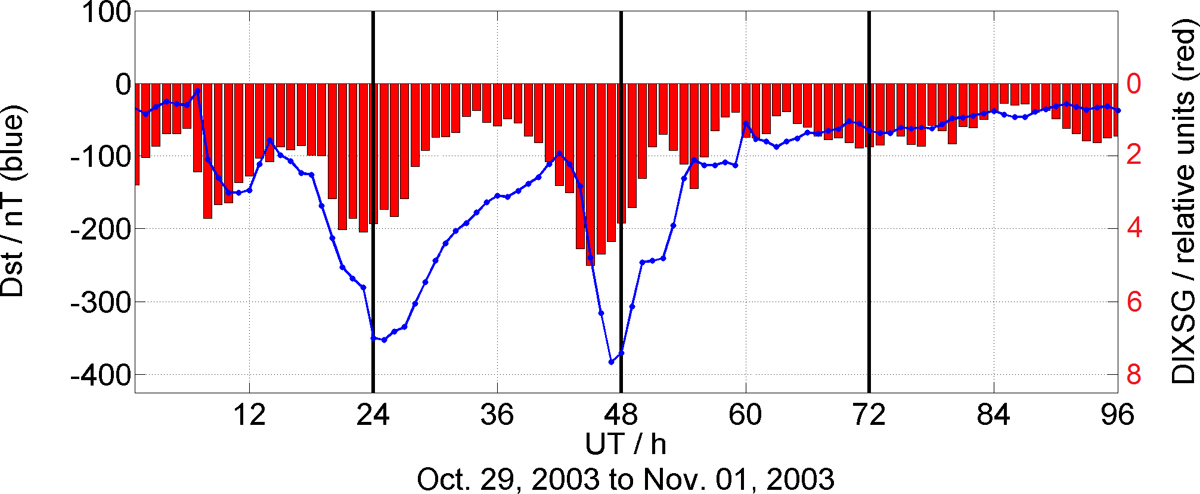
Global geomagnetic Dst value of the “Halloween Storm” in the period of Oct. 29 to Nov. 01, 2003 (blue line) and global mean of the five level DIXSG values (red bars). The calculation is based on public available 1/30 Hz GNSS data.
Current usage metrics show cumulative count of Article Views (full-text article views including HTML views, PDF and ePub downloads, according to the available data) and Abstracts Views on Vision4Press platform.
Data correspond to usage on the plateform after 2015. The current usage metrics is available 48-96 hours after online publication and is updated daily on week days.
Initial download of the metrics may take a while.