Fig. 12
Download original image
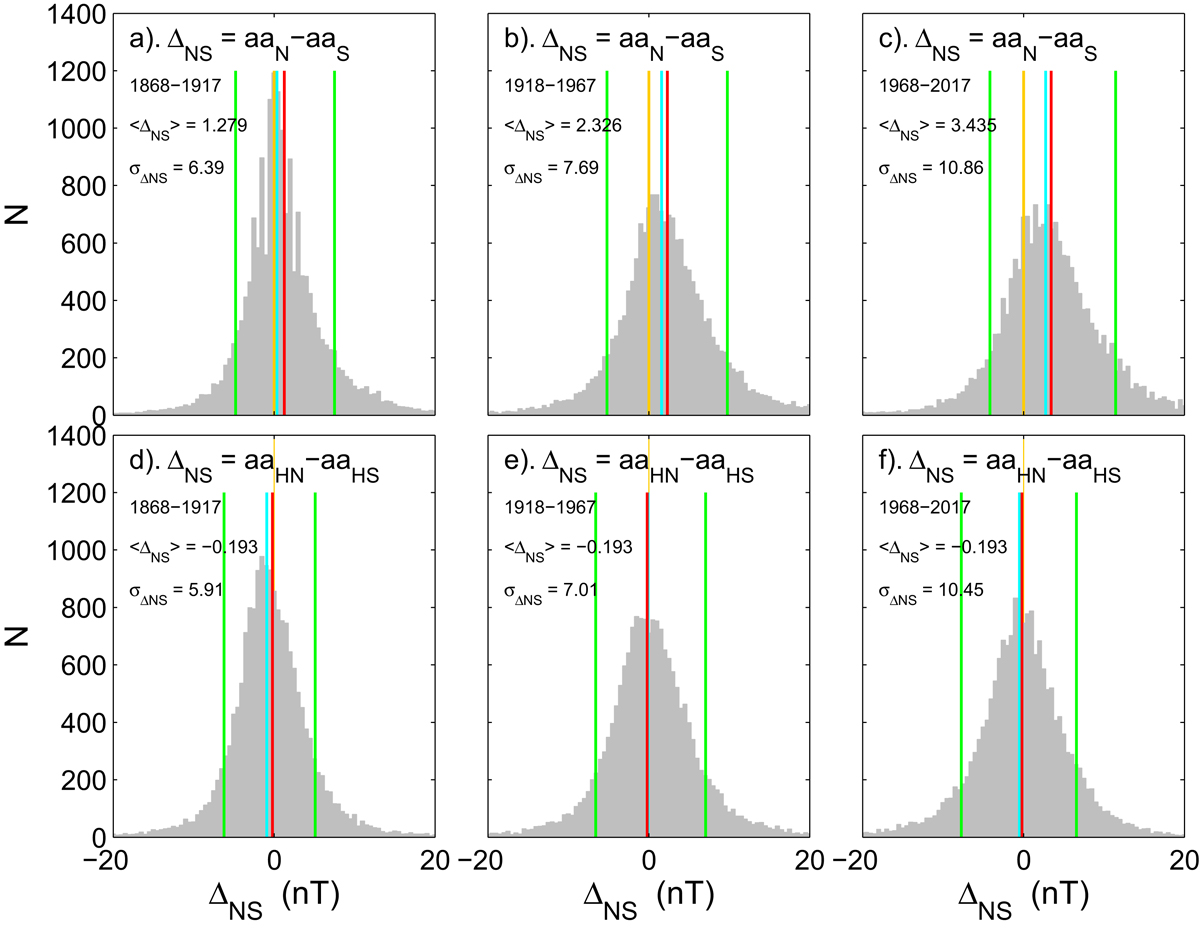
Distributions of the differences in daily means of northern and southern hemisphere indices, ΔNS, for 50-year intervals. The top row is for the classic aa indices, so that ΔNS = aa N − aa S. The bottom row is for the homogenised aa indices, so that ΔNS = aa HN − aa HS. Parts (a) and (d) are for 1868–1917 (inclusive); parts (b) and (e) are for 1918–1967; and parts (c) and (f) are for 1968–2017. In each panel, the vertical orange line is at ΔNS = 0, the vertical cyan line is the median of the distribution, the vertical red line the mean (〈ΔNS〉), and the green lines the upper and lower deciles. Note they are plotted in the order, orange, cyan, then red and so the mean can overplot the others (this particularly occurs in the bottom row). In each panel the distribution mean, 〈ΔNS〉 and the standard deviation, σΔNS, are given.
Current usage metrics show cumulative count of Article Views (full-text article views including HTML views, PDF and ePub downloads, according to the available data) and Abstracts Views on Vision4Press platform.
Data correspond to usage on the plateform after 2015. The current usage metrics is available 48-96 hours after online publication and is updated daily on week days.
Initial download of the metrics may take a while.