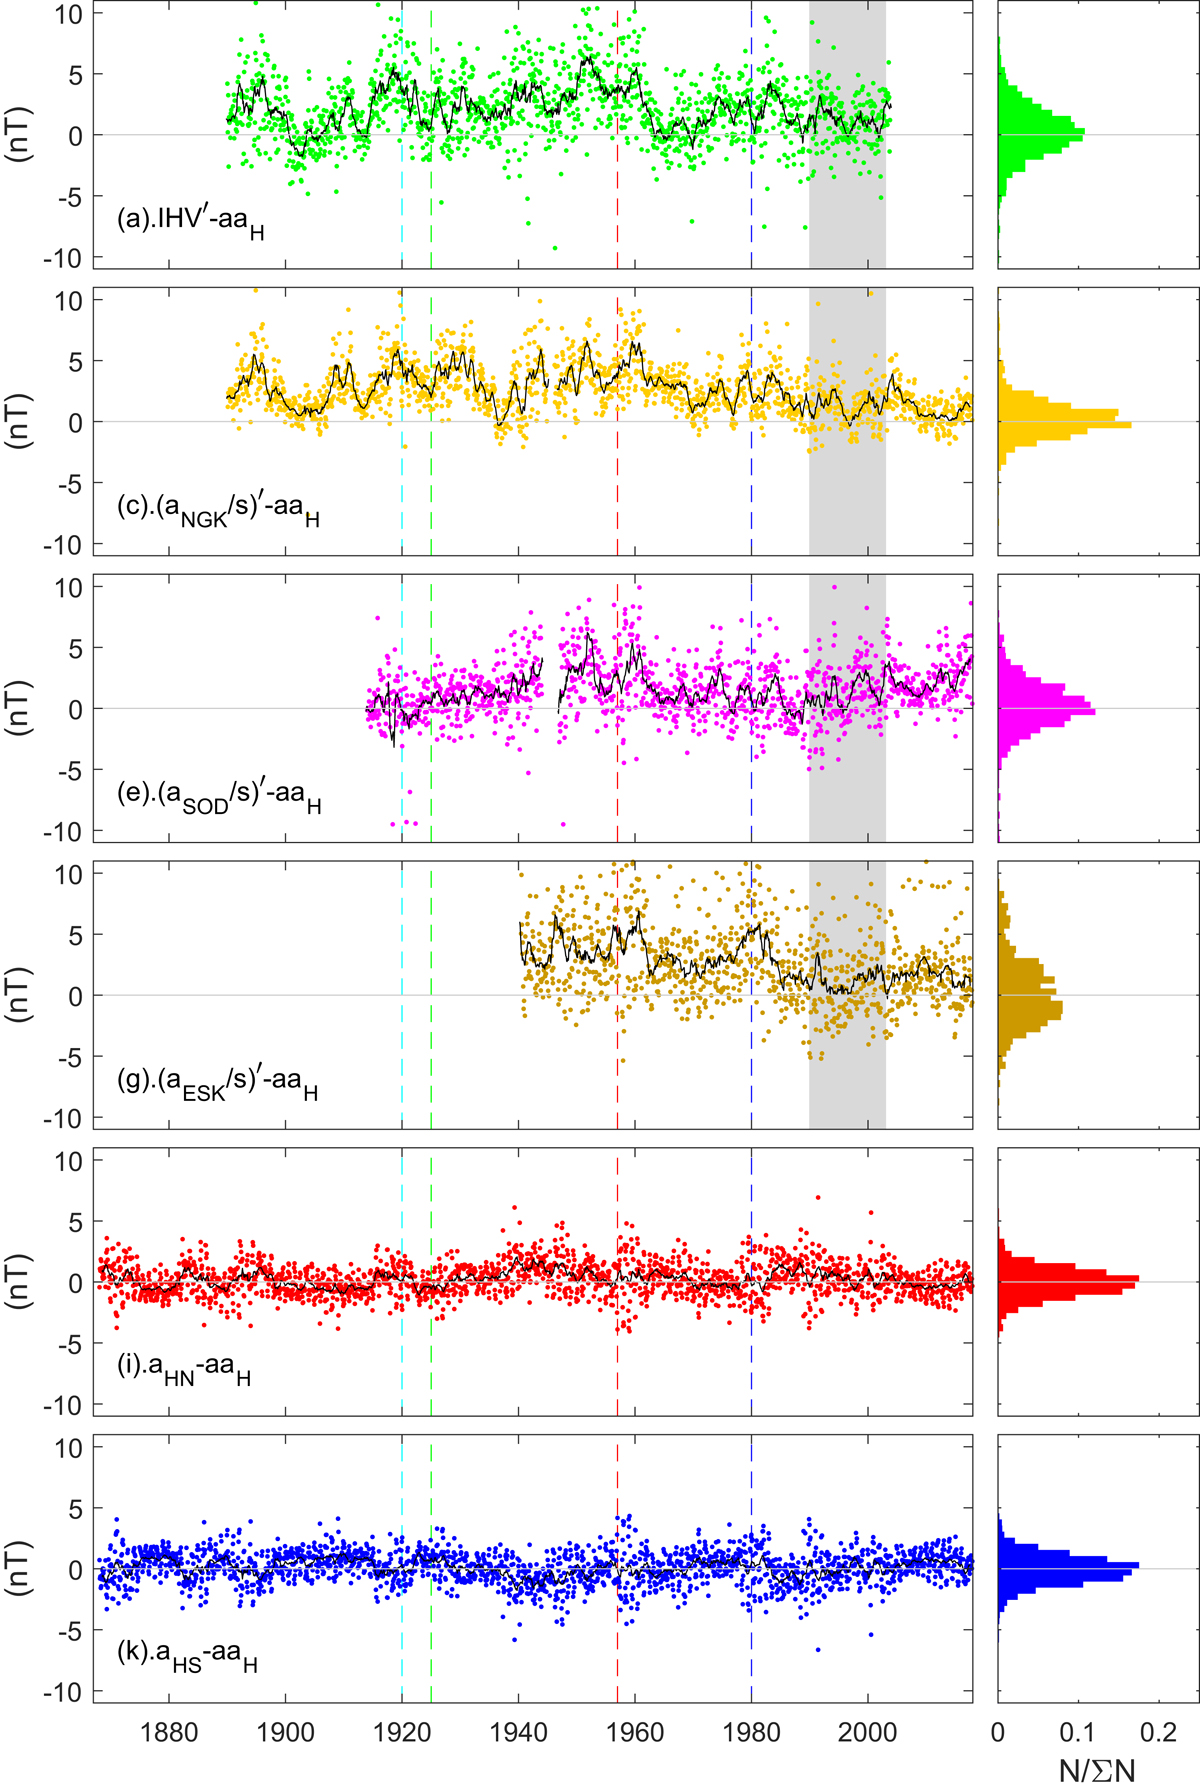
Fig. 14
Download original image
(Left-hand plots) Bartels rotation interval (27-day) means of the deviation of various scaled indices from the new aa H index (points) and 13-point running means of those 27-day means (black lines). The indices are all scaled by linear regression to the aa H index over the interval 1990–2003 (the interval shaded in gray). A prime on a parameter denotes that this scaling has been carried out. (Right-hand plots) The distribution of the deviations of the 27-day means (the dots in the corresponding left-hand plot) from their simultaneous 13-point smoothed running means (the black line in the corresponding left-hand plot). (a) and (b) are for the scaled IHV index, IHV′; (c) and (d) for the corrected and scaled a K index from Niemegk, (a NGK/s)′; (e) and (f) for the corrected and scaled a K index from Sodankylä, (a SOD/s)′; (g) and (h) for the corrected and scaled a K index from Eskdalemuir, (a ESK/s)′; (i) and (j) for the homogenized northern hemisphere aa index, aa HN; and (k) and (l) for the homogenized southern hemisphere aa index, aa HS. The dashed lines in the left-hand plots mark the dates of aa station joins, using the same colour scheme as used in Figure 2. Horizontal grey lines are at zero deviation.
Current usage metrics show cumulative count of Article Views (full-text article views including HTML views, PDF and ePub downloads, according to the available data) and Abstracts Views on Vision4Press platform.
Data correspond to usage on the plateform after 2015. The current usage metrics is available 48-96 hours after online publication and is updated daily on week days.
Initial download of the metrics may take a while.