Fig. 2
Download original image
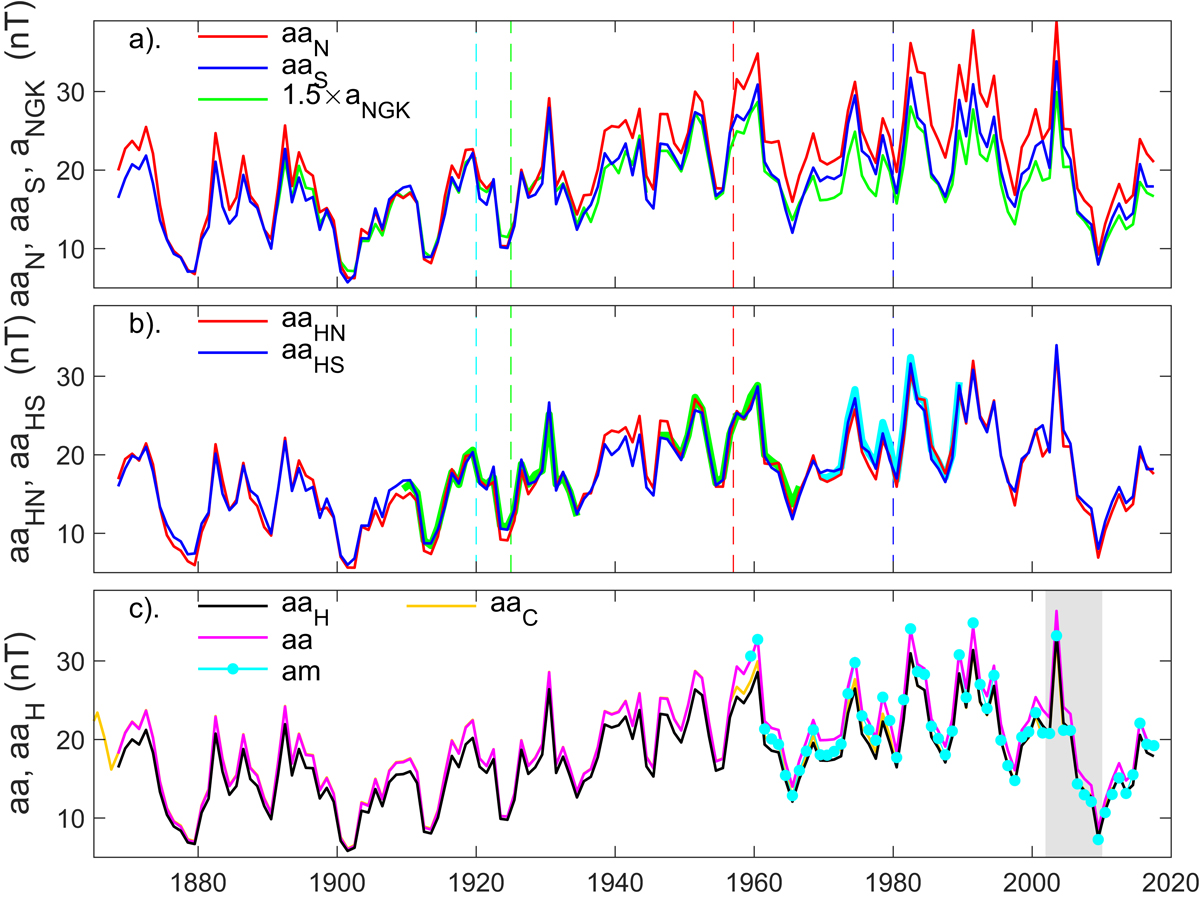
Variations of annual means of various forms of the aa index. (a) The published “classic” northern and southern hemisphere indices (aa N and aa S in red and blue, respectively). Also shown (in green) is 1.5 × a NGK, derived from the K-indices scaled from the Niemegk data. The vertical dashed lines mark aa station changes (cyan: Melbourne to Toolangi; green: Greenwich to Abinger; red: Abinger to Hartland; and blue: Toolangi to Canberra). (b) The homogenized northern and southern hemisphere indices (aa HN and aa HS in red and blue, respectively) generated in the present paper. The thick green and cyan line segments are, respectively, the a NGK and am index values used to intercalibrate segments. (c) The classic aa data series, aa = (aa N + aa S)/2 (in mauve) and the new homogeneous aa data series, aa H = (aa HN + aa HS)/2 (in black). The orange line is the corrected aa data series aa C generated by Lockwood et al. (2014) by re-calibration of the Abinger-to-Hartland join using the Ap index. (Note that before this join, aa and aa C are identical and the orange line is not visible as it is underneath the mauve line). The cyan line and points show annual means of the am index. The gray-shaded area in (c) is the interval used to calibrate aa HN and aa HS (and hence aa H) against am.
Current usage metrics show cumulative count of Article Views (full-text article views including HTML views, PDF and ePub downloads, according to the available data) and Abstracts Views on Vision4Press platform.
Data correspond to usage on the plateform after 2015. The current usage metrics is available 48-96 hours after online publication and is updated daily on week days.
Initial download of the metrics may take a while.