Fig. 7
Download original image
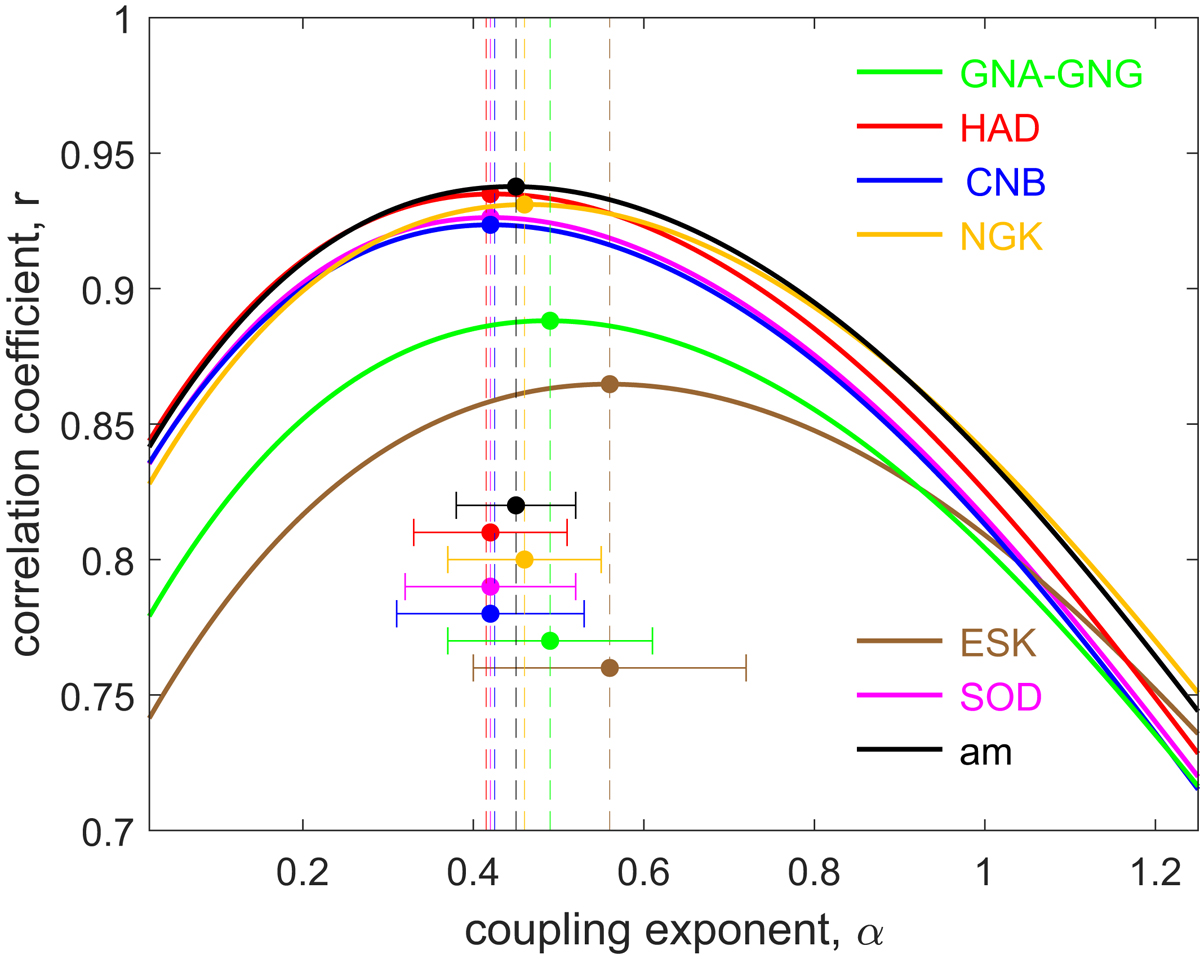
Correlogams showing the correlation between 27-day Bartels solar rotation means of power input into the magnetosphere, Pα, with the corrected a K indices, a K /s(δ), as a function of the coupling exponent, α. The colours are for the same data as used in Figure 6: (mauve) Sodankylä, SOD; (brown) Eskdalemuir, ESK; (orange) Niemegk, NGK; (red) Hartland, HAD; (blue) Canberra, CNB; and (green) a spline of Gangara, GNA and nearby Gingin, GNG (see text for details). The black line is the am index. The coloured dots and vertical dashed lines show the optimum α that gives the peak correlation. The horizontal bars show the uncertainty in the optimum α which is the larger of the two 1-σ uncertainties computed using the two procedures described by Lockwood et al. (2018c).
Current usage metrics show cumulative count of Article Views (full-text article views including HTML views, PDF and ePub downloads, according to the available data) and Abstracts Views on Vision4Press platform.
Data correspond to usage on the plateform after 2015. The current usage metrics is available 48-96 hours after online publication and is updated daily on week days.
Initial download of the metrics may take a while.