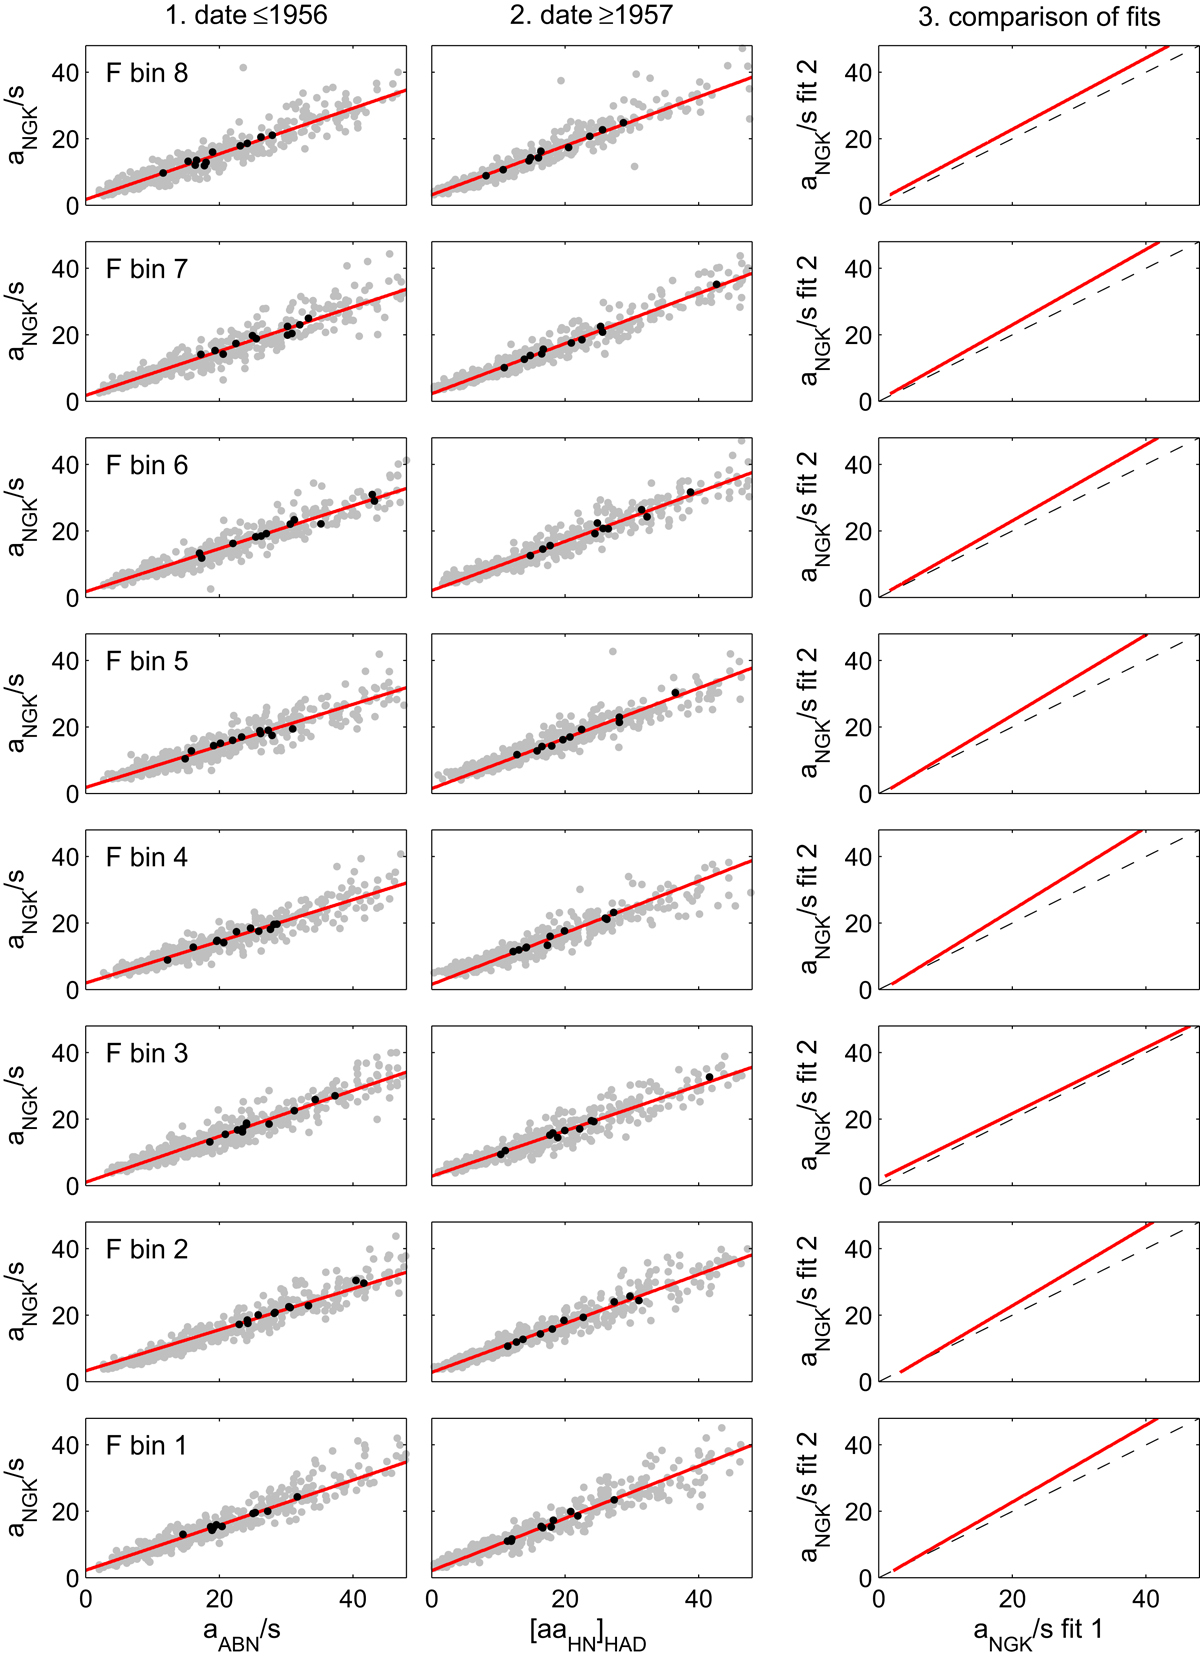
Fig. 8
Download original image
The intercalibration of aa N data across the join between the Hartland (HAD) and Abinger (ABN) observations in 1957. The data are divided into eight equal-length fraction-of-year (F) bins, shown in the 8 rows, with the bottom row being bin 1 (0 ≤ F < 0.125) and the top row being bin 8 (0.875 ≤ F < 1). The left-hand column is for an interval of duration 11-years (approximately a solar cycle) before the join and shows scatter plots of the aa data from Abinger (after division by s(δ) to allow for secular changes in the geomagnetic field) against the similarly-corrected simultaneous NGK data, a NGK /s(δ). The middle column is for an interval of duration 11-years after the join and shows the corresponding relationship between the already-homogenized aa data from Hartland [aa H]HAD and the simultaneous a NGK /s(δ) data. All axes are in units of nT. The grey dots are daily means to which a linear regression gives the red lines which are then checked against the annual means (for the F bin in question) shown by the black dots. The right-hand column shows the fitted lines for the “before” interval, 1, against the corresponding fitted line for the “after” interval, 2: the red line would lie on the dotted line if the two stations had identical responses at the F in question. The slope and intercept of these lines, giving the intercalibration of the two stations at that F, are given in Table 1.
Current usage metrics show cumulative count of Article Views (full-text article views including HTML views, PDF and ePub downloads, according to the available data) and Abstracts Views on Vision4Press platform.
Data correspond to usage on the plateform after 2015. The current usage metrics is available 48-96 hours after online publication and is updated daily on week days.
Initial download of the metrics may take a while.